10.4. Log-ratio/phase-difference analysis
Log-ratio/phase-difference analysis is a purely empirical technique that can be used to determine changes in the distribution parameters of the first coordination shell for certain kinds of data. This technique is most useful for data with a well-separated first coordination shell, i.e. one for which data from higher coordination shells is spectrally isolated from the first shell. An excellent example of a situation where this analysis would be useful would be a temperature series. In that case, log-ratio analysis can be used to measure the variation in σ2 as a function of temperature and phase difference analysis can be used to measure variation in bond length.
The approach of log-ratio/phase-difference analysis is to compare unknown data to a well known standard. The standard might be a room temperature measurement in the case of a temperature series. Or it might be a well ordered oxide for comparison with more disordered oxide forms. In any case, the analysis returns the differences between the standard and the unknown of the various cumulants of the distribution of atoms in the first shell.
The analysis is performed by first by Fourier filtering both the data and unknown to spectrally isolate the signal from the first coordination shell. Then polynomials are fitted to the log of the ratio of the amplitudes of the χ(q) functions and to the difference of the phases of the χ(q) function.
Log-Ratio(q)  = ln( Amp_unknown(q) / Amp_standard(q) )
Phase-Diff(q) = Phase_unknown(q) - Phase_standard(q)
These are fit using the cumulant expansion:
Log-Ratio(q)  = c_0 + 2*c_2 * q^2 + (2/3)*c_4 * q^4
Phase-diff(q) = 2 * c_1 * q - (4/3) * c_3 * q^3
The standard is selected from the menu at the top of this tool. The unknown is the current group, i.e. the one highlighted in the group list.
There are some other caveats along with the fact that this technique requires a spectrally isolated first shell.
- A perfectly ordered coordination shell is not necessary, but the distribution of atoms in the first shell must be well described by an expansion in a small number of cumulants. Thus, this technique may be inappropriate for highly disordered materials.
- Although this analysis is often referred to in the literature as “model independent analysis”, that is as much a shortcoming as an advantage. The technique can be used to measure changes in structural cumulants, but cannot be used to measure absolute values of those cumulants.
- This analysis cannot be performed on higher coordination shells except in the vary rare case of a second shell which is spectrally isolated both from the first shell and from all higher shells.
- The presence of spectral weight from any higher shell or from any multiple scattering paths will add considerable systematic uncertainty to this analysis.
When you select Log-Ratio from the main menu, the main window is replaced with the log-ratio/phase-difference tool, shown below.
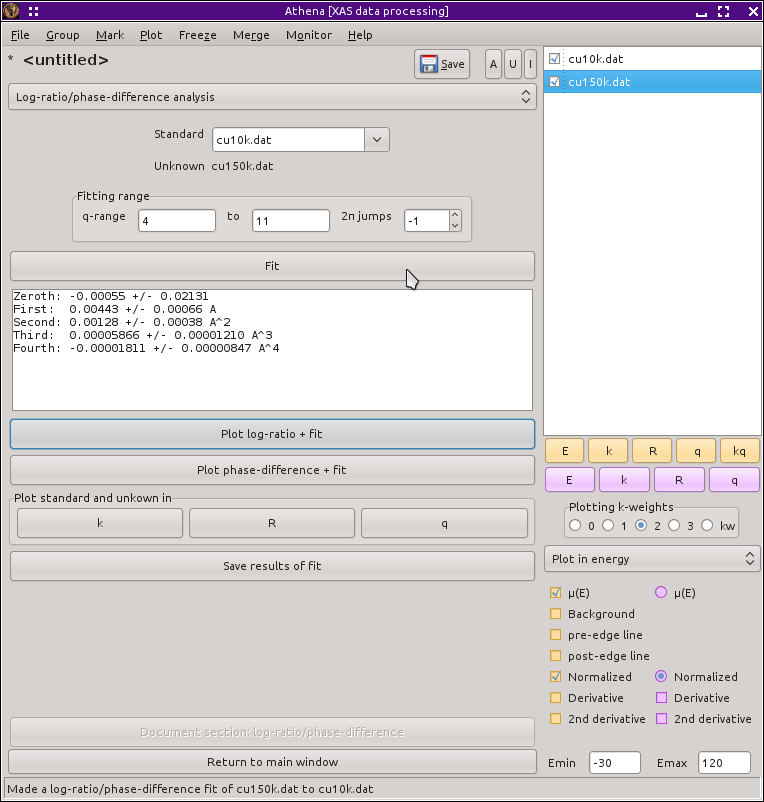
Fig. 10.19 The log-ratio/phase-difference tool.
Once you select Fourier transform parameters and ranges for use in the analysis, you can click the Fit button to perform the fit. The fit to the log-ratio of the amplitudes is plotted when the fit is over. The buttons can be used to plot either the fit to the log-ratio of amplitudes or the fit to the phase difference. The fits use all cumulants up to the fourth. Depending on your data quality, choice of Fourier transform ranges can be important and quite sensitive. You can save the log-ratio and phase-difference data along with the fits to a file by clicking the Save ratio data and fit button.
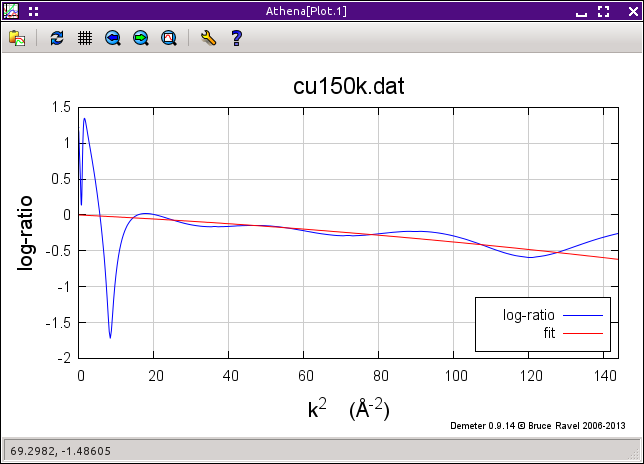
Fig. 10.20 The results of the log-ratio fit to the Cu metal.
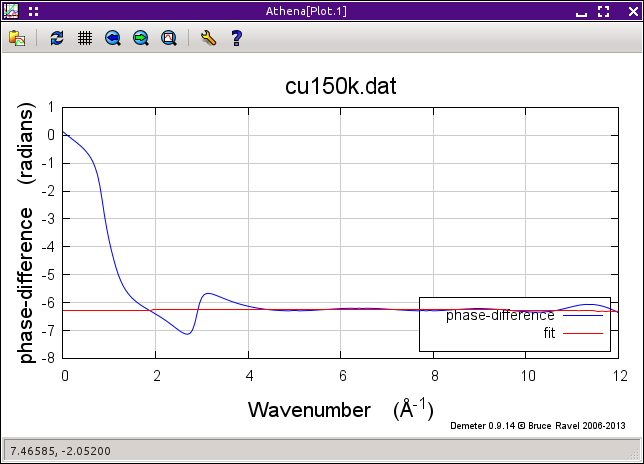
Fig. 10.21 The results of the phase-difference fit to the Cu metal.
The three plot buttons behave just like the purple plot buttons would behave were only the standard and unknown marked.
My favorite explanation of this analysis method is
- Grant Bunker. Application of the ratio method of EXAFS analysis to disordered systems. Nuclear Instruments and Methods in Physics Research, 207(3):437 – 444, 1983. doi:10.1016/0167-5087(83)90655-5.
DEMETER is copyright © 2009-2016 Bruce Ravel – This document is copyright © 2016 Bruce Ravel
This document is licensed under The Creative Commons Attribution-ShareAlike License.
If DEMETER and this document are useful to you, please consider supporting The Creative Commons.