The History window
ARTEMIS keeps a complete history of your fitting project. After
each fit, your fitting model and the state of the program are saved as
part of the fitting project. When a project file is written, this
history is stored in the project file. This allows you to compare
fits or even to revert ARTEMIS to an earlier fit.
Interactions with the fit history are via the History window, which is
shown and hidden using the History button on the left side of the Main
window.
The History window shows two major controls. On the left is a list
all fits performed as part of the fitting prject. Like many other
lists in ARTEMIS, this contains elements that can be selected and
marked. This list uses multiple selection, so control-clicking can be
used to add to the selection and shift-clicking can be used to select
groups of fits. Much of the analysis discussed below uses the
selection. Some functionality uses the set of marked fits.
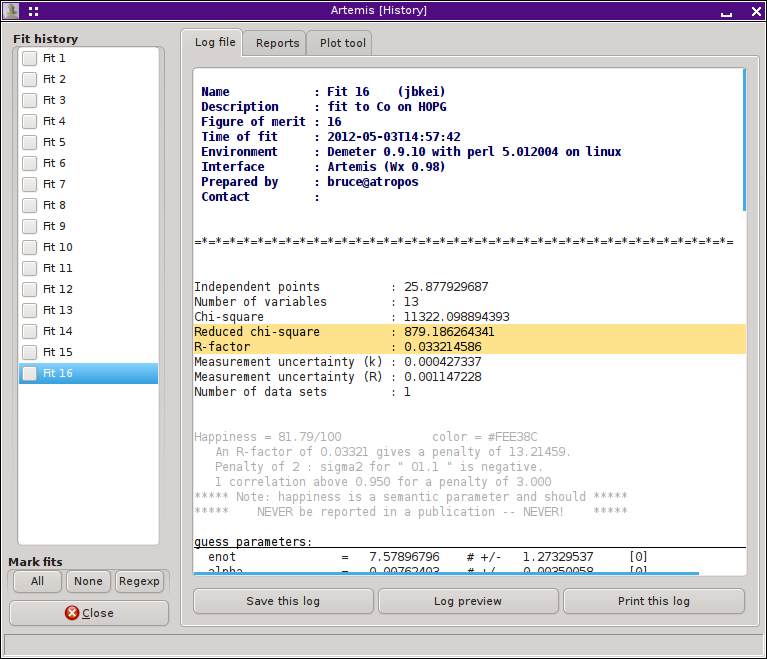
On the right is a notebook. The first tab is for displaying the log
files from old fits. The log file displayed when the most recent fit
is clicked upon is identical to the log file displayed in the Log
window.
You may find that there is a short pause between clicking on a fit and
seeing its log file displayed. When importing a project file,
ARTEMIS delays importing the fits until one is explicitly needed.
For a large project file, this greatly speeds up import at the small
cost of a pause when examining log files.
 Each fit in the list will display a context menu when right clicked.
Again, there may be a short pause before the menu gets posted. In
that menu are a variety of functions related to the fit history.
Each fit in the list will display a context menu when right clicked.
Again, there may be a short pause before the menu gets posted. In
that menu are a variety of functions related to the fit history.
-
Restore fitting model
-
An prior fitting model can be restored. This will clear all of
ARTEMIS's windows and replace them with content from that
fit.
-
Save log file
-
The log file displayed can be written to a text file. You will be
prompted for a file name and location.
-
Export fit
-
The fit can be exported to an ARTEMIS project file containing only
that fit in the fit history.
-
Discard fit(s)
-
The current or the set of marked fits can be discarded from the project.
-
Show YAML
-
The last item is a tool used to help debug problems in ARTEMIS.
It displays ARTEMIS's internal representation of the fit in
a text window.
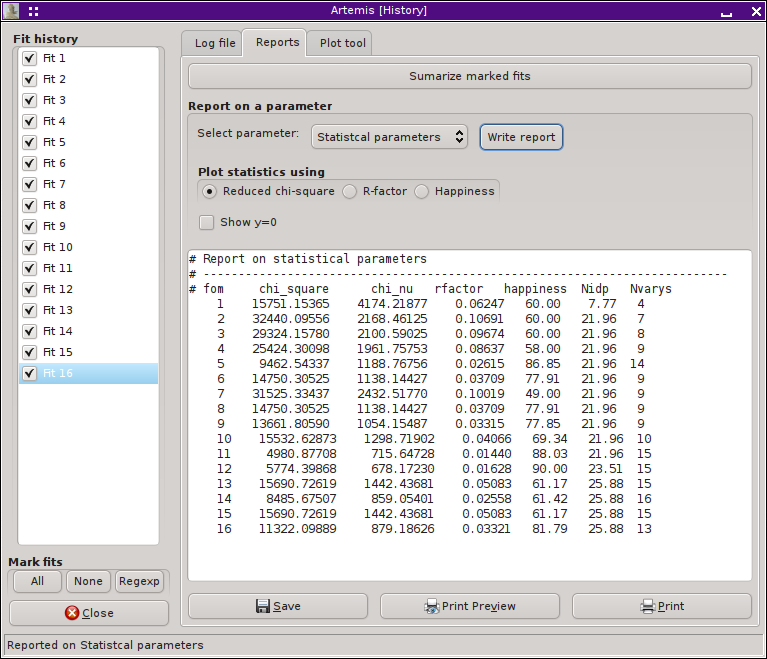
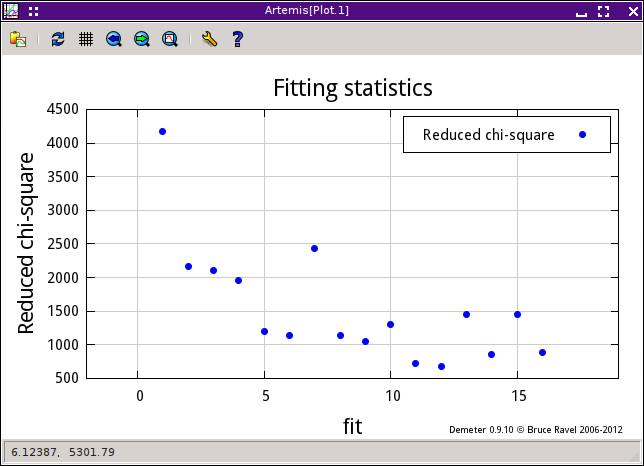
Reports on fits
The second tab is used to analyze groups of fits. In the example
shown above, the progression of χ²ν values throughout
the development of the fitting model is shown both as a textual report
and as a plot. Similar plots can be made for individual parameter
values.
Only the marked fits are included in the report. If no fits are
marked, then all fits will be marked before the report is generated.
Simple controls for setting the marks are at the bottom of the list.
The buttons marked “All” and
“None” set and clear all marks. The
“Regexp” button will prompt you for a
pattern to match against all fit names.
When a fit is selected from the list, the
“Select parameter” menu is populated with
the names of the parameters used in that fit. All parameter types are
included. Selecting a new item from the menu or clicking the
“Write report” button will generate a new
report and its plot.
For statistics, all of χ², χ²ν, R-factor, and the
happiness are reported. You can choose which of χ²ν, R-factor,
and happiness to have displayed in the resulting plot. Clicking the
“Show y=0” button forces the plot to be
scaled of the y-axis such that y=0 is shown.
Buttons at the bottom of this tab allow you to save the report as a
text file or to send it to the printer.
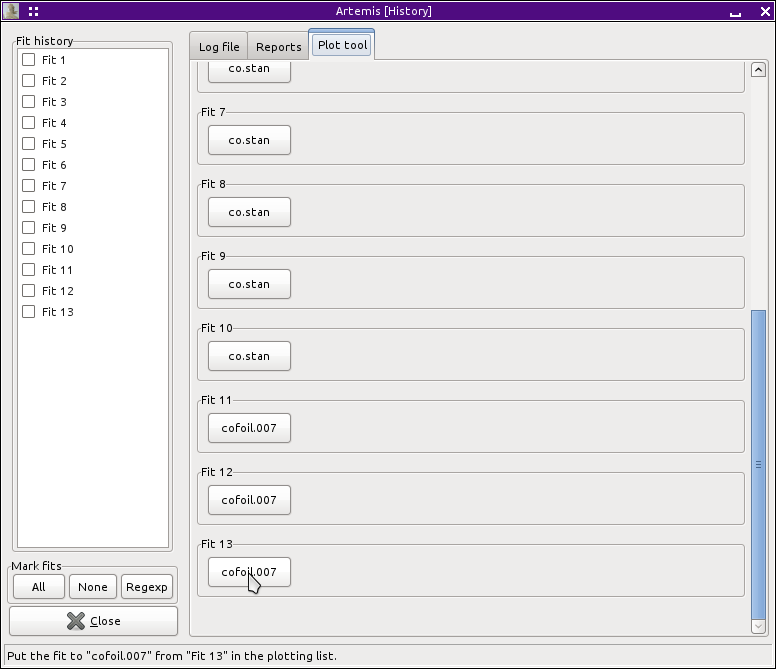
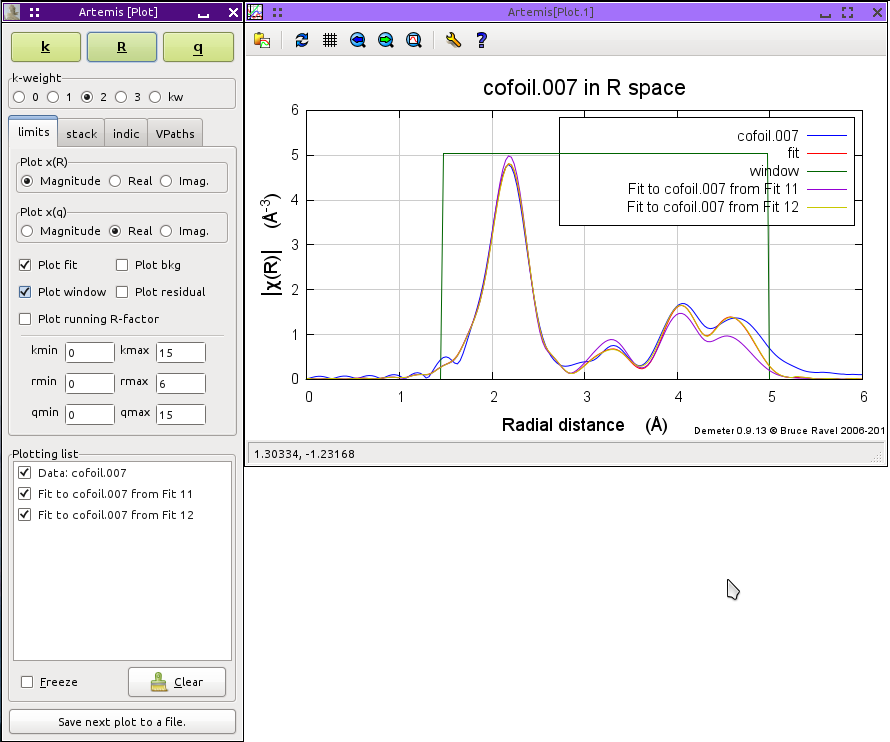
Plotting fits
The plot tool tab is used to place old fits in the Plotting list for
comparison with data and with the current fit. As you perform fits
(or when a project file is imported), an entry on the
“Plot tool” page is made for each fit.
Within the box associated with each fit is one button for each data
set included in the fit. The example below is of a single data set
fit to Co metal, thus each fit has a single button associated with
it.
Clicking one of the buttons on the
“Plot tool” page makes an entry in the
plotting list. These will then be plotted just like any other item in
the plotting list.
Note that it is usually not necessary to put the most recent plot in
the plotting list in this way. If the
“Plot fit” button is checked on and a data
group is in the plotting list, the most recent will be plotted by
default. Fit items in the plotting list will
be stacked when
the stacking option is in play.
|