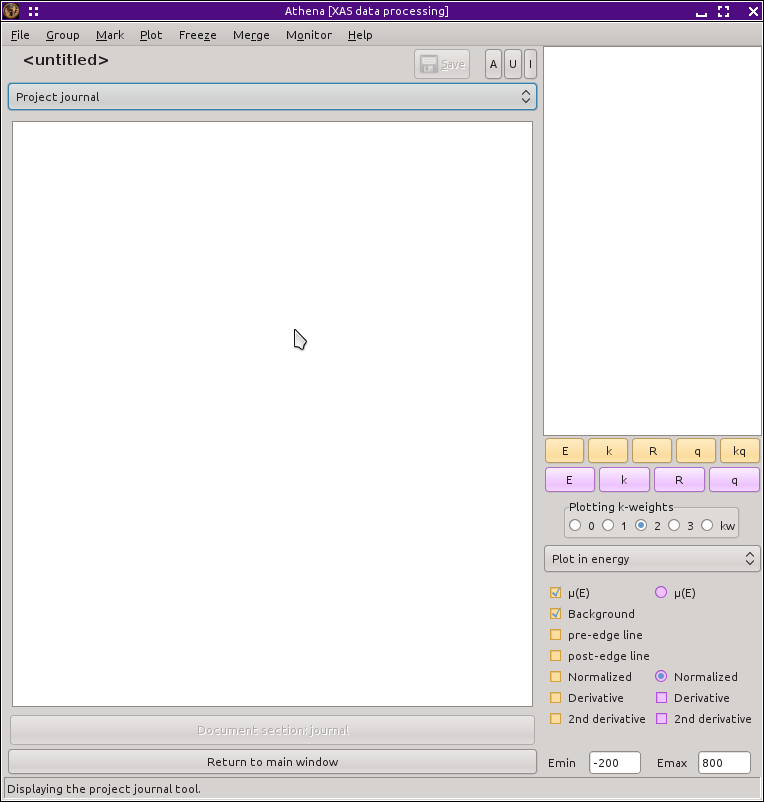
The Log and Journal windows
The Log window
After the fit completes and the result of the fit is plotted, the Log
window is displayed. The “Log” button on
the bottom left of the Main window is used to display and hide this
window.
 All of the details of the fit are recorded in the text displayed in
this window. Below the descriptive fitting properties displayed at
the top in blue text are the main fitting statistics, including
χ², χ²ν, the R-factor, ε(k), ε(R),
and counts of the number of independent points and the number of guess
parameters. Those are followed by the details of
the happiness
evaluation. Two lines of the fitting
statistics are colored with the same color determined from the
happiness and used for the Fit button and the various plotting
buttons.
Following the statistical parameters are tables of the guess, def,
set, restraint, and after parameters. Error bars are given for the
guess parameters. Correlations between guess parameters follow.
Scrolling down in this, you find tables of evaluated path parameters
for each of the paths and each of the data sets. Note that
unceretainties are not propagated through to
the path parameters. In the current version of ARTEMIS, that
chore is left for the user.
The text in the log file is identical to the log text from the most
recent fit in the
History window.
The buttons at the bottom of the Log window can be used to save the
log to a text file or to print its contents.
The Journal window
|
 Clicking the “Journal” button on the right
side of the Main window displays and hides the Journal window. This
is simply a blank text box in which you can write notes about your
fitting project or love letters to your collaborators. The text found
in this box will be saved to and restored from the project file.
The buttons at the bottom of the Log window can be used to save the
journal to a text file or to print its contents.
| ![[Artemis logo]](./../images/Artemis_logo.jpg)

