Spline clamps and k-weight in background removal
Spline clamps
One of the shortcomings of the use of piece-wise splines to
approximate the background function is that the ends of spline are
somewhat ill-defined by virtue of not having more data preceding or
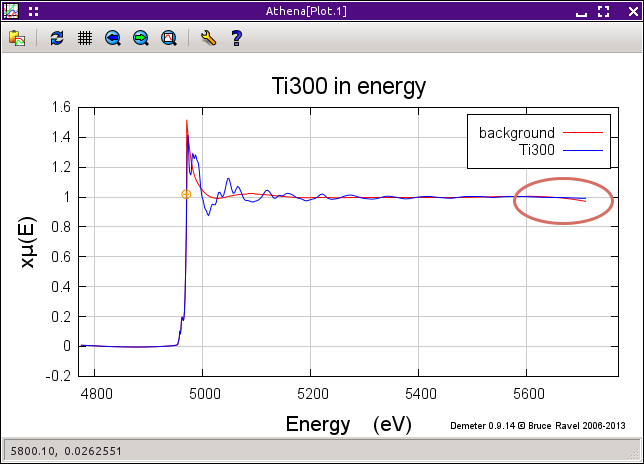
following. At times, this can result in the end of the spline
splaying up or down, away from the μ(E) data. This results in
significant distortion to χ(k) data.
IFEFFIT provides a tool called
spline clamps. These work by adding an
additional term to the χ² metric used to fit the spline to
the μ(E) data. The difference between the spline and the data is
computed for the first and last five data points. This sum of
differences computed in energy is multiplied by a user-chosen scaling
factor and added to the χ² computed from the R-range below
«rbkg». This has the effect of
“clamping” the spline to the ends of the
data range. In other words, we use the prior knowledge that μ₀(E)
is a smooth function through the oscillatory structure of μ(E) to
put a restraint on the fit used to determine μ₀(E).
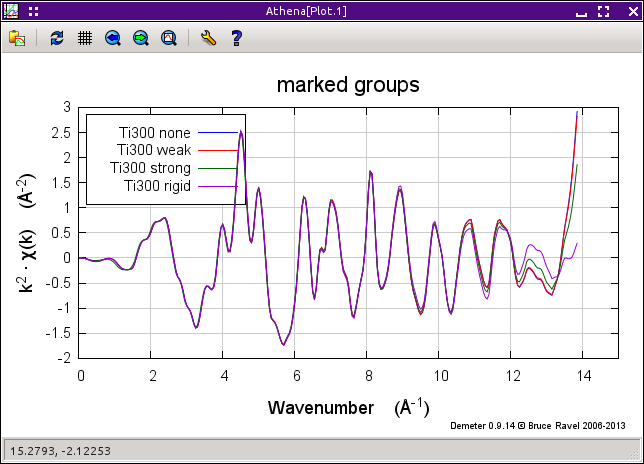
The user-selected multiplicative coefficient takes one of six
predefined values:
“none”,
“slight”,
“weak”,
“medium”,
“strong”, or
“rigid”. These
have values of 0, 3, 6, 12, 24, and 96, respectively and serve to set
the strength of the clamp in the evaluation of χ².
The default value of the clamp is “none” at
the low end of the energy range and “strong”
at the high end. Clamps tend not to help at the low energy end of the
data. Since the μ(E) data is changing so quickly near the edge,
biasing the spline to follow the data closely rarely helps improve the
quality of the χ(k) data. A strong clamp at the high energy
frequently improves the behavior of the spline near the end of the data.
The behavior of the clamping mechanism can be configured using the
preference tool.
The ♦Bkg → nclamp preference
changes the number of points at the end of the data range included in
the calculation of the effect of the clamp. The
♦Bkg → clamp1 and
♦Bkg → clamp2 parameters set
the strengths of the two clamps. The strengths of the clamps can be
fine tuned by changing the numeric values. The parameter
♦Clamp → weak sets the the weak
clamp value, and so on.
The effect of k-weight on background removal
The background removal section has its own «k-weight»
parameter which is distinct from the k-weight used for
plotting and Fourier transforms. The background removal
«k-weight» is the value used to evaluate the
Fourier transform performed to determine the background spline. By
varying the value of this «k-weight», you
can emphasize the lower or upper end of the data in the determination
of the background.
For clean data with oscillatory structure at high energy that is small
but observable, you may find that a larger value of the background
removal «k-weight» produces a better
χ(k) spectrum. In fact, setting this parameter to 2 or 3 can
have a similar impact on the data as the highest value of the spline
clamp shown in the image above.
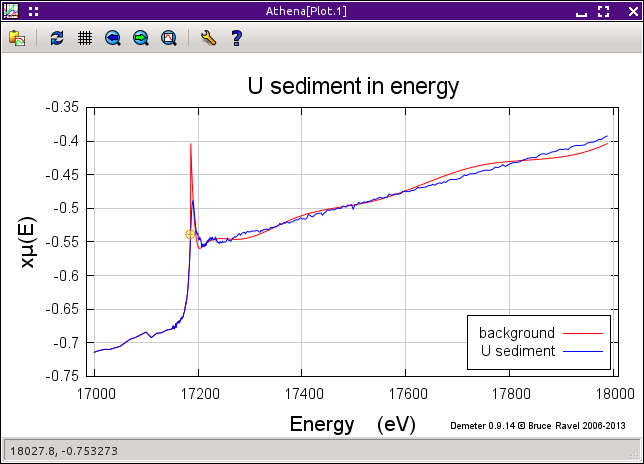
However, in data which are quite noisy, amplifying the noise by a
large value of «k-weight» can have a
dramatic effect leading to a very poor evaluation of μ₀(E).
Indeed, the μ₀(E) evaluated from noisy data with a large value of
«k-weight» will sometimes oscillate
wildly, as shown in
the example below.
The interaction between spline clamps and k-weight
The spline clamp and
«k-weight» parameters
sometimes interact strongly. The criterion that μ₀(E) follow
closely to the end of the data that is imposed by the spline clamp can
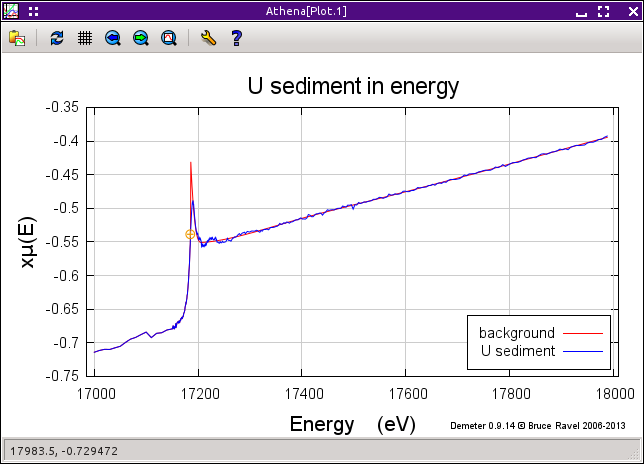
have a surprising effect on noisy, heavily k-weighted data. This is
what happened in the data shown in the previous section. Reducing the
strength of the spline clamp can sometimes help.
Sometimes your data are well served by a low
«k-weight» and a strong spline clamp.
Other times, a large
«k-weight» and a
weak clamp work better. Still other times, a strong
«k-weight»
and
a strong clamp work best. How do you know what to do? There are no
hard and fast rules, although you will develop an intuition for how
different data will respond to different parameter values.
Don't be shy about trying different combinations.
![[Athena logo]](../../images/pallas_athene_thumb.jpg)


