Indicators
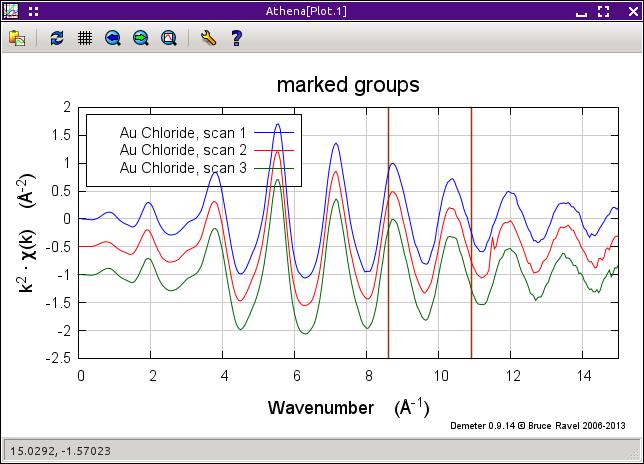
Indicators are vertical lines drawn from the top to the bottom of the
plot frame. They are used to draw attention to specific
points in plots of your data. This can be useful for comparing
specific features in different data sets or for seeing how a
particular feature propagates from energy to k to q.
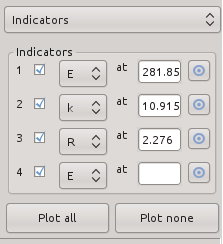
Points to mark by indicators are chosen using
the pluck buttons
in the indicators tab. Click on the pluck button then on a spot in
the plot. That value will be inserted into the adjacent text entry
box. When the “Display indicators” button is
selected, the indicator lines will be plotted (if possible) in each
subsequent plot.
Points selected in energy, k, or q are plotted in any of those
spaces. Points selected in R can only be plotted in R. Points
outside the plot range are ignored.
The following preferences can be set to customize the appearance of
the indicators.
♦Plot → nindicators: the
maximum number of indicators that can be set
♦Plot → indicatorcolor: the
color of the indicator line
♦Plot → indicatorline: the
line type of the indicator
![[Athena logo]](../../images/pallas_athene_thumb.jpg)