Stacked plots
When marked group plots are made using the purple plot buttons, the
default behavior is to overplot the various data groups. At times, it
might be preferable to place an offset between the plots. This is
done in general by setting the «y-axis offset»
parameter. Stacking plots in a systematic manner is done using the
stack tab. Stacking is done by setting the
«y-axis offset» parameters of the marked
groups sequentially.
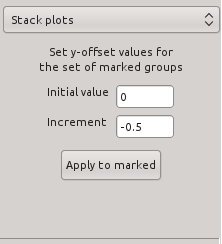
This tab contains two text entry boxes. The first is used to set the
«y-axis offset» parameter of the first
marked group. Subsequent marked groups have their
«y-axis offset» parameters incremented by
the amount of the second text entry box. Clicking the
“Set y-offset values” button sets these
values for each marked group.
![[Athena logo]](../../images/pallas_athene_thumb.jpg)