3.2. Merging data
Merging data is one of the essential data processing steps. As with every thing, DEMETER tries to make merging as easy as possible:
my $merged = $data[0]->merge('e', @data);
The first argument to the merge method specifies which spectrum is
merged: e means to merge μ(E), n means to merge normalized
μ(E), and k means to merge χ(k).
The caller is included in the merge. Care is taken not to double count the caller – if the caller will be removed from the argument list. This is a convenience because, as shown above, you can simply pass an entire array which also contains the caller.
The merge method returns a new Data object.
Both of the plot types below (stddev and varience) ignore many
settings of the Plot object in order to plot the data in the form in
which it was merged. That is, DEMETER does not in any way
propagate the uncertainty array through background removal or Fourier
transforms. Trying to make one of these plots in a space other than
the merge space will not work. Attempting to plot the standard
deviation or variance plots with a Data object that does not contain
merged data will return as error.
3.2.1. Plot merged data with standard deviation
1 2 3 4 5 6 7 8 9 10 11 12 13 14 15 16 17 18 19 20 | #!/usr/bin/perl
use Demeter;
my @common = (energy => '$1', numerator => '$2', denominator => '$3', ln => 1,);
my $prj = Demeter::Data::Prj -> new(file=>'U_DNA.prj');
my @data = (
Demeter::Data -> new(file => 'examples/data/fe.060',
name => "Fe scan 1",
@common,
),
Demeter::Data -> new(file => 'examples/data/fe.061',
name => "Fe scan 2",
@common,
),
Demeter::Data -> new(file => 'examples/data/fe.062',
name => "Fe scan 3",
@common,
),
);
my $merged = $data[0] -> merge('e', @data);
$merged -> plot('stddev');
|
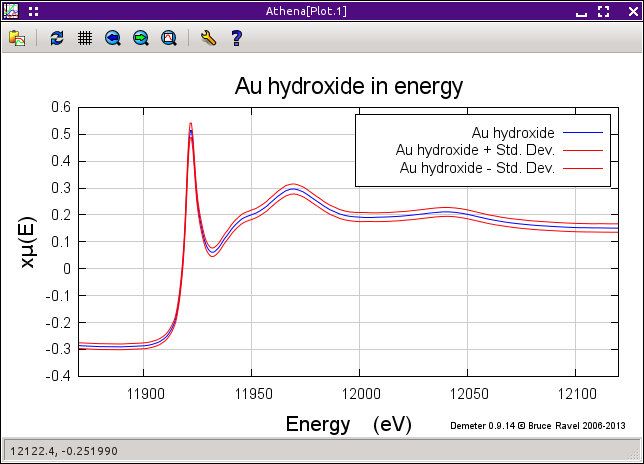
Fig. 3.1 This shows the merge of μ(E) of 3 iron foil scans along with the standard deviation array.
The standard deviation has been added to and subtracted from the μ(E) spectrum, so the red trace is an error margin for the μ(E) spectrum. Note that this plot type can only be plotted using a Data object which contains the data from a merge. Trying to plot a non-merged Data object in this way will return a warning without plotting anything.
3.2.2. Plot merged data with variance
Change line 20 in the script above to this:
$merged -> plot('variance');
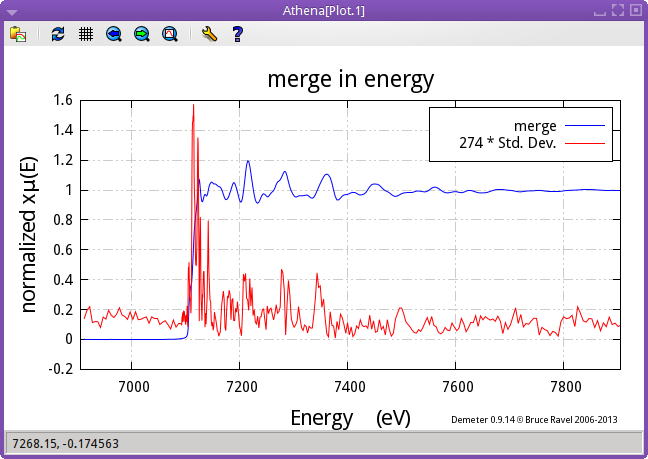
Fig. 3.2 This shows the merge of μ(E) of 3 iron foil scans along with the standard deviation array.
The standard deviation has been scaled to plot with the μ(E) spectrum, with the scaling factor is given in the legend. This, then, is a way of visualizing how the standard deviation is distributed across the spectrum. Note that this plot type can only be plotted using a Data object which contains the data from a merge. Trying to plot a non-merged Data object in this way will return a warning without plotting anything.
DEMETER is copyright © 2009-2016 Bruce Ravel – This document is copyright © 2016 Bruce Ravel
This document is licensed under The Creative Commons Attribution-ShareAlike License.
If DEMETER and this document are useful to you, please consider supporting The Creative Commons.