8.1. Column output files
After doing a lot of analysis, you will eventually need to make beautiful pictures for publication. As a glance at any of the screenshots in this document will attest, the graphical output of ATHENA is adequate but far from beautiful. Fortunately, ATHENA can export your data in a variety of ways and in a format that can be imported easily into almost any other program, such as a spreadsheet or a graphics package such as Origin or Kaleidegraph.
The current data set – the one marked in red in the group list and the one whose parameters are displayed in the main window – can be saved in a number of ways. The various choices are listed under the File menu, as seen in the figure below. Note that χ(k) data can be saved with various k-weightings using the entries in the submenu.
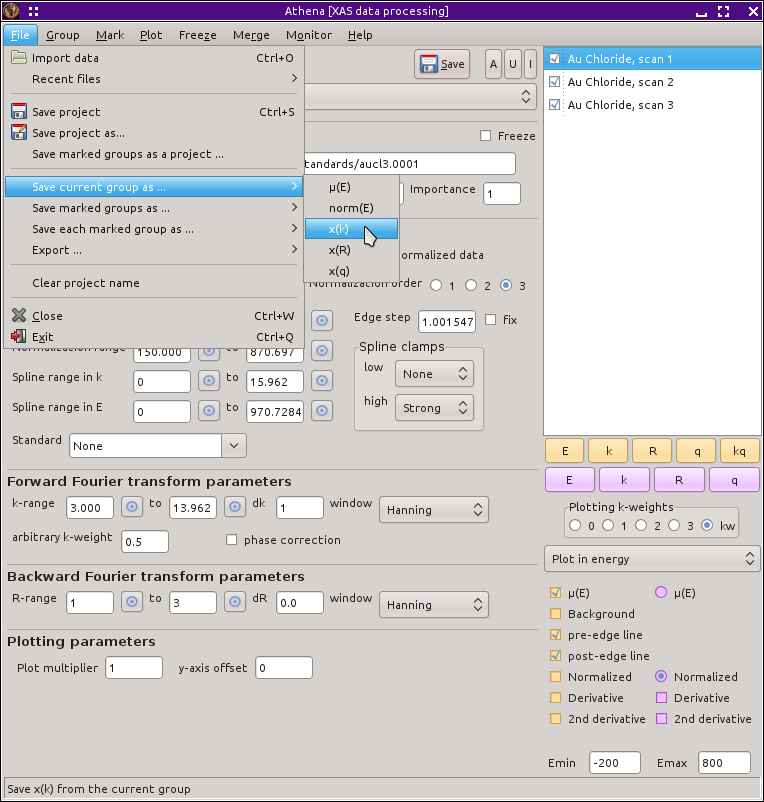
Fig. 8.1 Exporting a column data file for a group.
The columns in the μ(E) output file are:
- energy
- μ(E)
- background
- pre-edge line
- post-edge line
- derivative of μ(E)
- second derivative of μ(E)
- I0
If the data group is marked as being XANES data, then the background column will be all zeros.
The columns in the norm(E) output file are:
- energy
- normalized μ(E)
- normalized background
- flattened μ(E)
- flattened background
- derivative of normalized μ(E)
- second derivative of normalized μ(E)
If the data group is marked as being XANES data, then the normalized and flattened background columns will be all zeros.
The columns in the χ(k) output files are:
- k
- unweighted χ(k)
- k-weighted χ(k)
- k-squared-weighted χ(k)
- k-cubed-weighted χ(k)
- Fourier transform window
- Energy in absolute units
The χ(R) output file contains both parts of the complex Fourier transform, as well as the magnitude and phase. That is, of course, redundant, but it's also convenient. The columns are:
- R
- real part of χ(R)
- imaginary part of χ(R)
- magnitude of χ(R)
- phase of χ(R)
- back transform window
For the sake of clarity, we use the letter “q” to represent Fourier filtered wavenumber. The χ(q) output file also contains both parts of the complex back transform, as well as the magnitude and phase.
- q
- real part of χ(q)
- imaginary part of χ(q)
- magnitude of χ(q)
- phase of χ(q)
- Fourier transform window
- χ(k) with the k-weighting used in the FT
In certain situations, it is much more convenient to write column data files containing data from many groups. This is done with the help of the mark buttons. The data from each of the marked groups can be saved in a variety of forms using the Save marked groups submenu, as shown below.
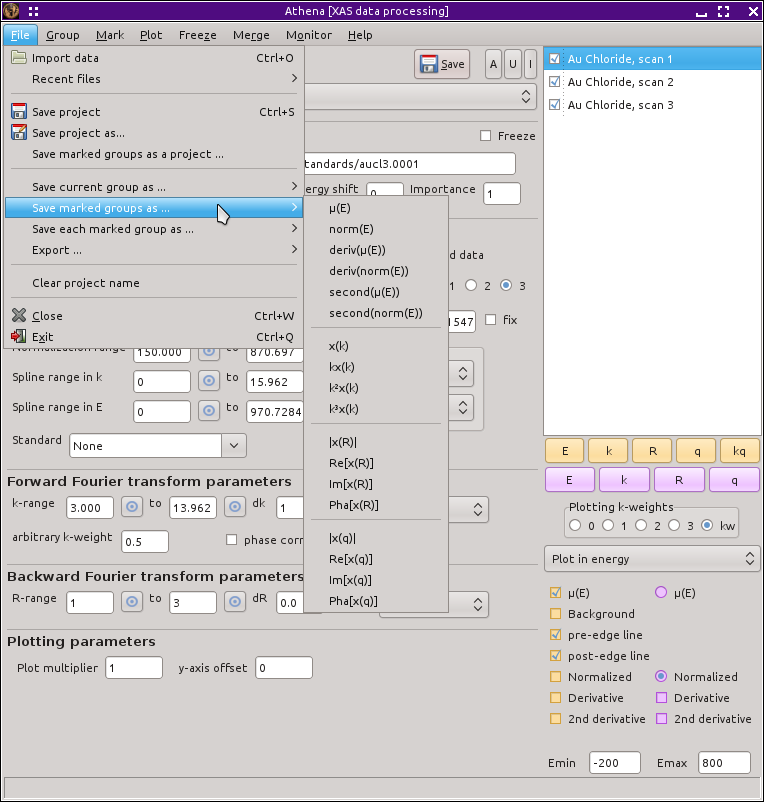
Fig. 8.2 Exporting column data files for the set of marked groups.
The output file will contain the x-axis value (i.e. energy, k, R, or q) in the first column. The remaining columns will contain each of the marked data groups, in the order they appear in the group list.
The final column output option is to export each of the marked groups as a single data column file of the sort described above. When you select one of the output file types shown below you are prompted to select a directory. Each marked group will be exported to a file in that directory with a file name formed from the group label.
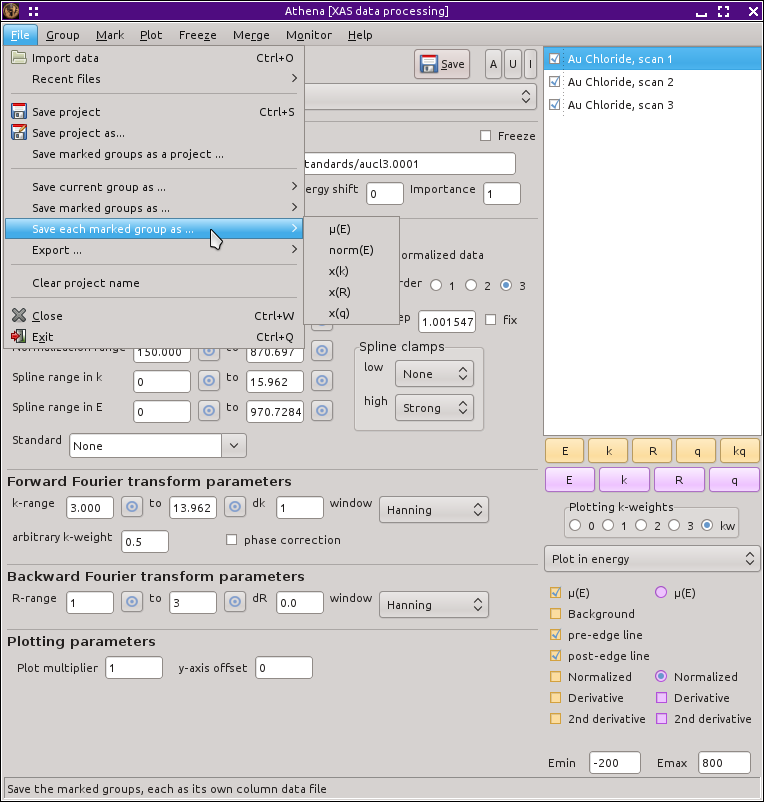
Fig. 8.3 Exporting column data files for each of the marked groups.
The standard folder selection dialog is used for exporting each marked group. Select a folder and each file will be recorded there.
The output files discussed on this page have a header of the form shown below. The first line identifies the version of ATHENA used to write the file.
# XDI/1.0 Athena/0.9.24
# Element.edge:                  K
# Element.symbol:                Fe
# Column.1:                      energy eV
# Column.2:                      xmu
# Column.3:                      bkg
# Column.4:                      pre_edge
# Column.5:                      post_edge
# Column.6:                      der
# Column.7:                      sec
# Column.8:                      i0
# Athena.e0:                     7105.50673
# Athena.eshift:                 0
# Athena.rbkg:                   1.0
# Athena.importance:             1
# Athena.standard:               None
# Athena.bkg_kweight:            2
# Athena.edge_step:              2.8319775
# Athena.fixed_step:             no
# Athena.pre_edge_range:         -150.000 -30.000
# Athena.pre_edge_line:          3.299290 - 0.000471541 * E
# Athena.normalization_range:    150.000 1757.437
# Athena.post_edge_polynomial:   33.632797 - 0.00697211 * E + 3.70151752e-07 * E^2 + 0 * E^3
# Athena.spline_range_energy:    0.000 1857.468
# Athena.clamps:                 0 24
# Athena.spline_range_k:         0.000 22.080
# Athena.kweight:                2
# Athena.window:                 hanning
# Athena.phase_correction:       no
# Athena.k_range:                3.000 20.080
# Athena.dk:                     1
# Athena.r_range:                1 3
# Athena.dr:                     0.0
# Athena.window:                 hanning
# Athena.plot_multiplier:        1
# Athena.y_offset:               0
# ///
#------------------------
#   e         xmu        bkg        pre_edge        post_edge        der        sec        i0
DEMETER is copyright © 2009-2016 Bruce Ravel – This document is copyright © 2016 Bruce Ravel
This document is licensed under The Creative Commons Attribution-ShareAlike License.
If DEMETER and this document are useful to you, please consider supporting The Creative Commons.