Creating and plotting VPaths
A common problem with visualizing the paths that contribute to a fit
occurs when several single and multiple scatteriung paths contribute
spectral wieght in the same region of R spadce. In a well-ordered
material like these data on a cobalt foil, a distant single scattering
path may be of the same length as two or more important collinear
multiple scattering paths. The fit involves a subtle superposition of
all the paths in the fit. This single scattering path and its related
multiple scattering paths all contribute spectral weight in the same
region of R-space.
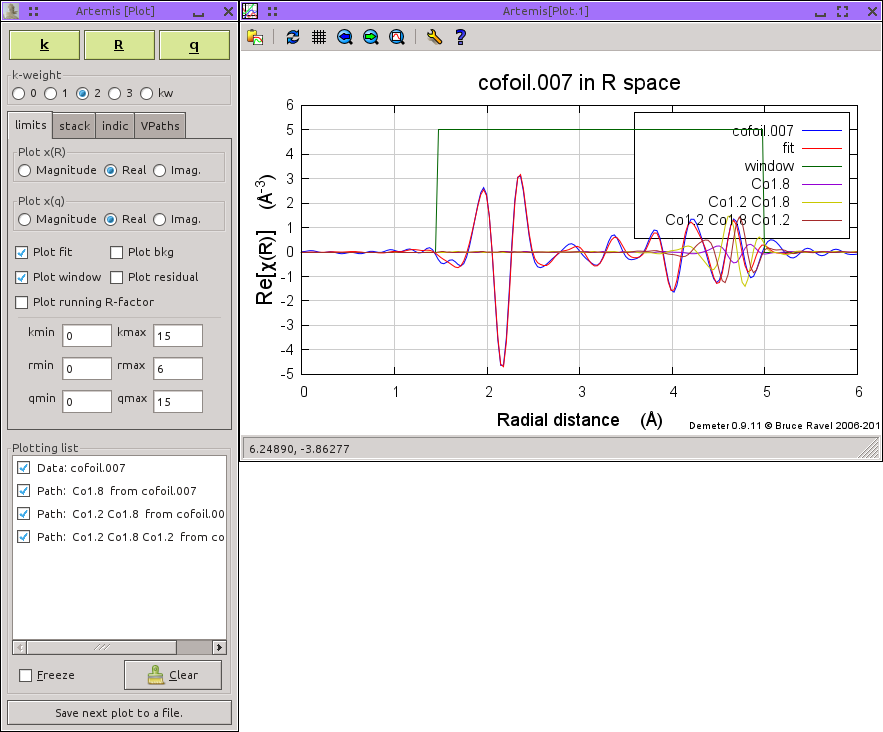
Plotting them together results in a complicated figure with lots of
overlapping traces. It is hard to see how each path contributes to
the fit. Indeed, it is hard to ascertain much beyond the fact that
these three paths have a complicated phase relationship between them.
ARTEMIS offers a handy visualization tool called a virtual path,
or VPath. A VPath is simply a group of paths which are added together
after being evaluated in a fit. The sum of these paths is then
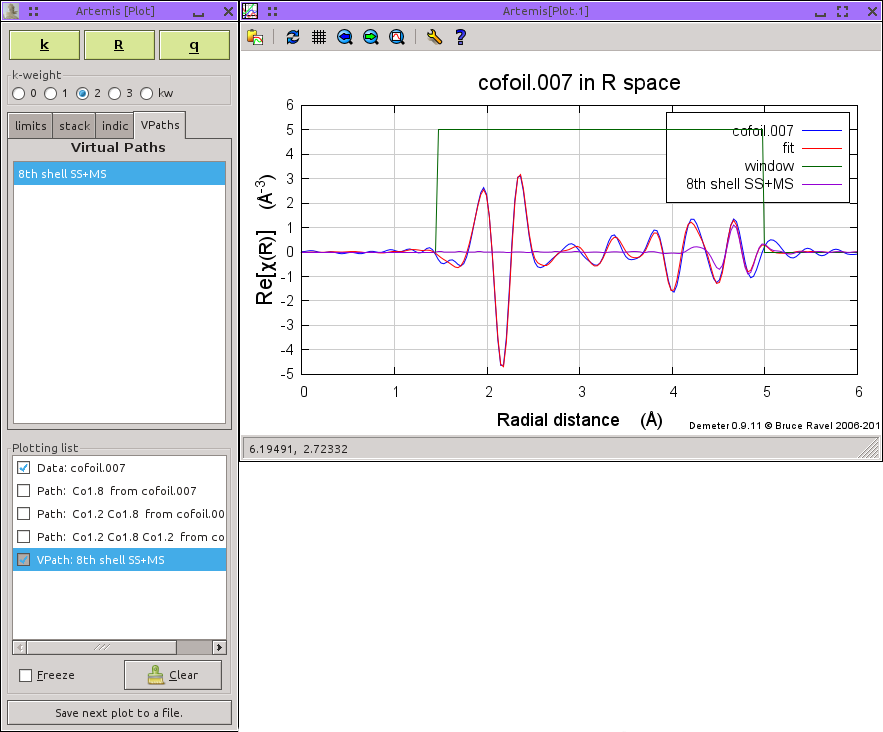
plotted as a single item in a fit. Here is the plot made with the
VPath constructed from the three paths in the previous figure. While
this plot hides the individual contributions of the three path, it
shows how those three affect the fit when added together.
 The VPath is made by marking the contributing paths and choosing
“Make VPath” from the Actions menu. You
will be prompted for a name for the VPath. This name will be used to
identify the VPath in a plot. The VPath is then inserted into the
list of the VPaths tab.
|
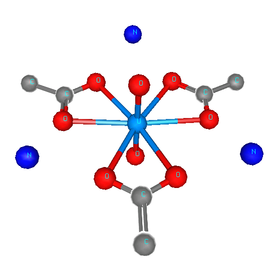 Here is another example of how a VPath can help visualize the
components of a fit. The data in the follow two figures are of
uranium LIII edge EXAFS of uranyl acetate in solution. Uranyl
compounds are notable for having two, very short double-bonded oxygen
atoms in a trans configuration and at a distance of about 1.78
Å. The remaining oxygen atoms lie in an equatorial plane. These
are single-bonded and at a distance of around 2.4 Å.
The two axial oxygen atoms usually have a rather small σ² and
contribute very strongly at low R in the Fourier transform. Because
those oxygen atoms are at such a short distance, there are a few
multiple scattering paths that contribute significant spectral weight
just beyond the region dominated by single scattering from the
equatorial oxygen atoms.
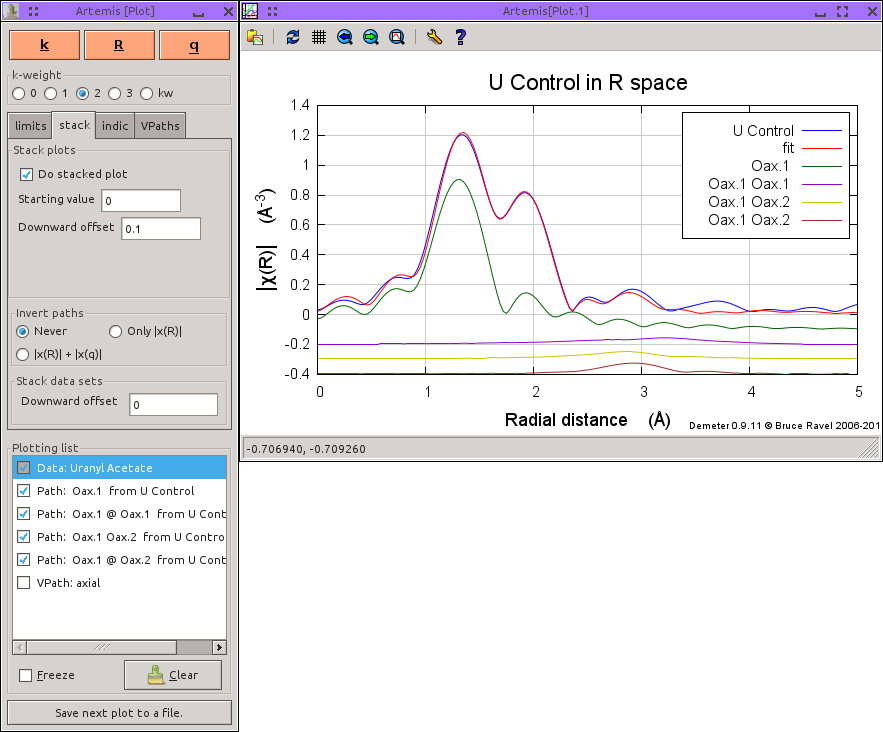
Here is the plot the fit to the uranyl acetate data along with each of
the single and multiple scattering paths that involve the axial
oxygen atoms. Again, it is ahrd to appreciate how the various
multiple scattering paths contribute to the fit.
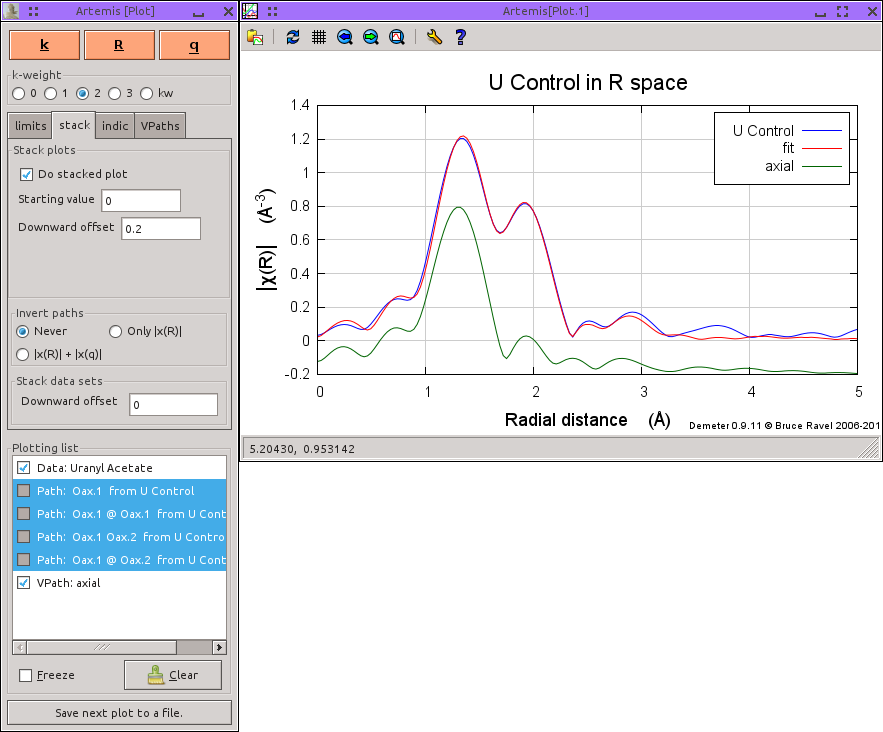
In this case, it is nice to combine all these paths into a VPath
which represents the entire contribution to the EXAFS from the axial
oxygen atoms.
| ![[Artemis logo]](../../images/Artemis_logo.jpg)
