Calibrating data groups
Putting data on an absolute energy grid
Data calibration is the process of selecting a point in your data as
the edge energy and applying an energy shift to your measured data so
that the selected point is at a specified value. For metals, that
value is usually the tabulated edge energy.
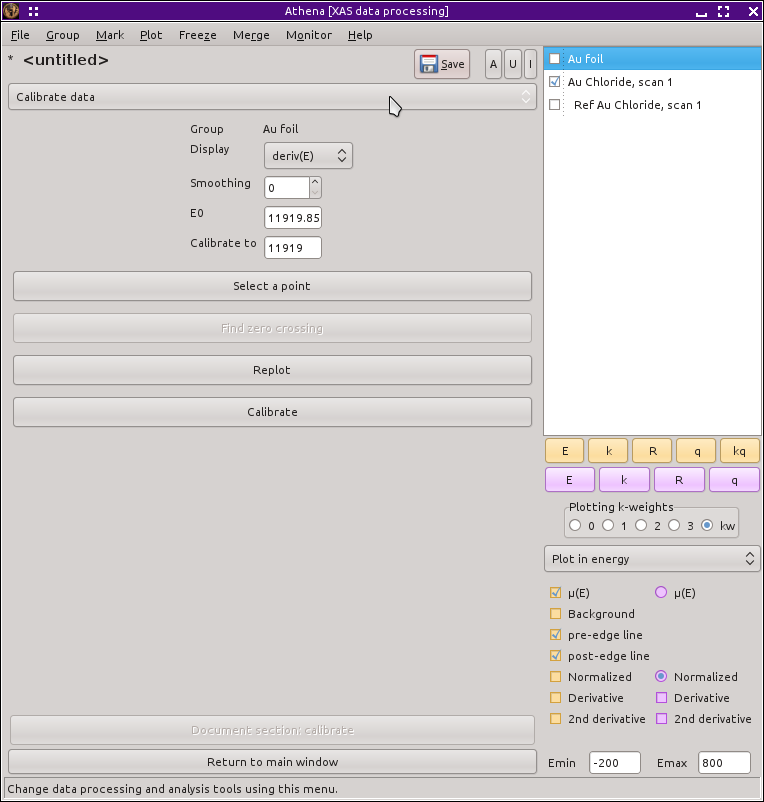
When this tool
above
starts, the current group is plotted as the
derivative of μ(E). The menu allows you plot the data as
μ(E), normalized μ(E), derivative of μ(E), or second
derivative of μ(E). If your data is noisy, you may find it helpful
to apply smoothing. IFEFFIT's simple three-point smoothing
algorithm is applied the number of times indicated, then the data are
replotted.
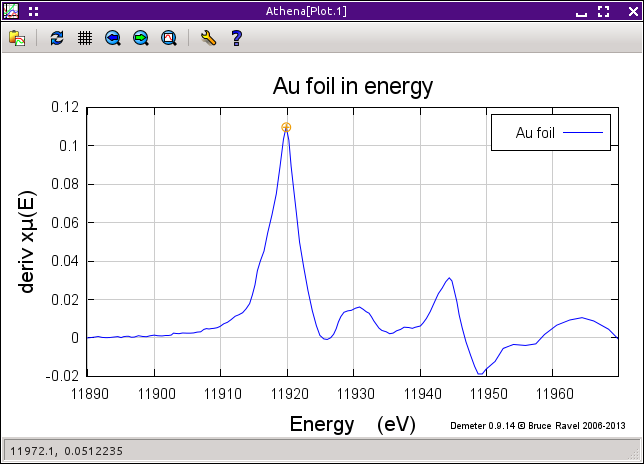
The selected point is shown in the plot with the orange circle, as
shown in
the plot below. You
can type in a new value in the “Reference”
box or click the “Select a point” button then
click on a point in the plot. By default, the “Calibrate to” box contains the tabulated edge energy of the
absorber measured for these data, but that too can be edited.
When you plot the second derivative, the “Find
zero crossing” button becomes enabled. This finds the zero
crossing of the second derivative that is nearest to the current value
of the reference point. When plotting the second derivative,
smoothing helps, even for fairly clean data.
When you click the “Calibrate” button, the values of
«E0» and «Energy shift»
are set for the current group such that the selected point in the data
takes the calibration value.
![[Athena logo]](../../images/pallas_athene_thumb.jpg)