![[Athena logo]](../../images/pallas_athene_thumb.jpg)
Home
Forward
Introduction
Importing Data
Background Removal
Plotting
User Interface
Setting parameter values
Output files
Data processing
↪ Calibration
↪ Alignment
↪ Merging
↪ Rebinning
↪ Deglitching and truncation
↪ Smoothing
↪ Convolution and noise
↪ Deconvolution
↪ Self-Absorption correction
↪ Dispersive XAS
↪ Multi-electron excitation
↪ Copy series
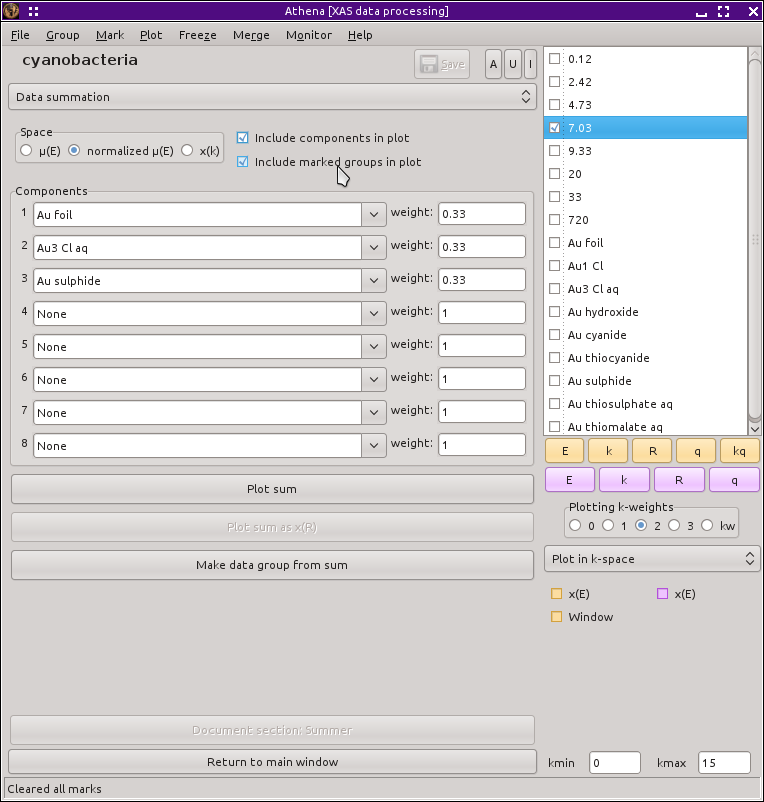
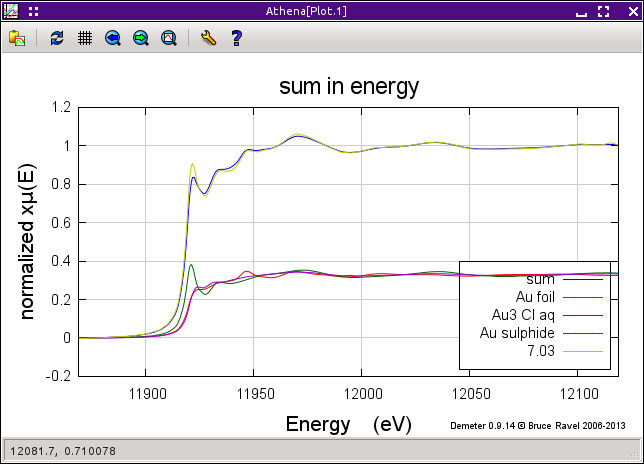
↪ Data summation
Data analysis
Other main window chores
Worked examples
Hephaestus