Pluck buttons
Interaction between Athena and the plot window
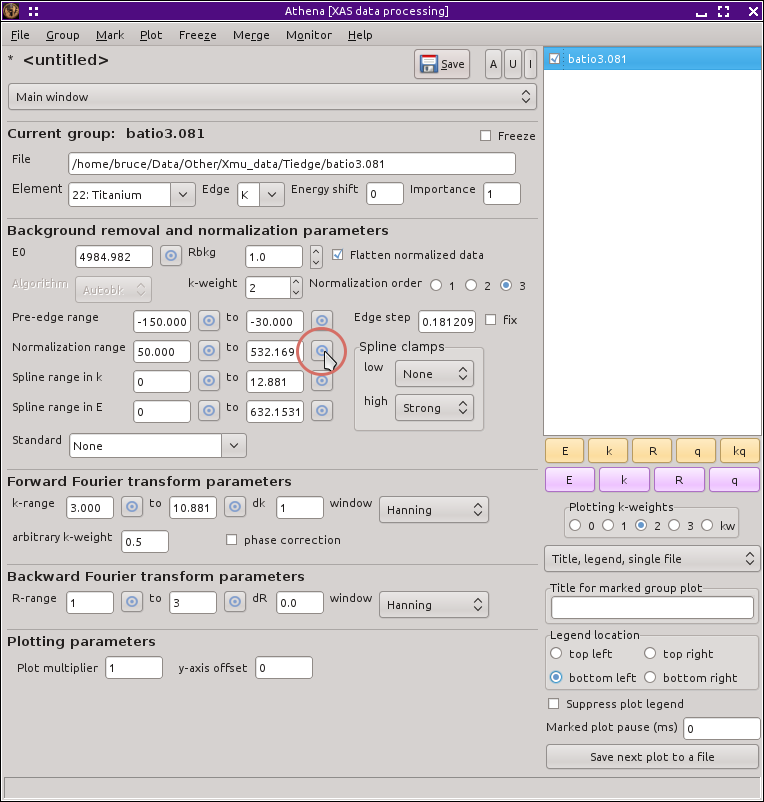
Almost every text entry box that takes an energy or wavenumber value
as its parameter has a little button next to it which is decorated
with a small blue X, one of which is highlighted in
the figure below.
These are the pluck buttons and their
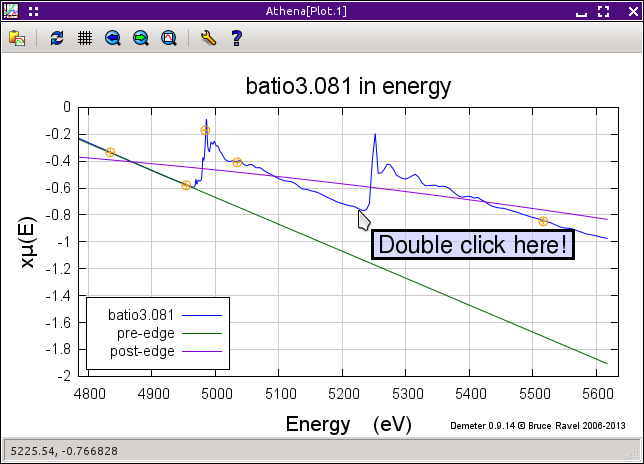
purpose is to grab a value directly from the plot. When you click one
of these buttons, a message in the echo area prompts you to select a
point from the plot, demonstrated in
the next figure.
When you click on the plot, the x-axis value of
the point you clicked on gets inserted in the associated entry box.
Along with the pluck buttons in the main window, several data
processing and data analysis tools use pluck buttons, as does the
indicator
plot options tab.
![[Athena logo]](../../images/pallas_athene_thumb.jpg)