2.8. Plotting and basic data processing
2.8.1. Types of plots
Once you have imported data, you will want to start doing interesting things with it. “Interesting things” are, of course, the topic of the rest of this programming guide. The first interesting thing to discuss is plotting.
One might think that topics such as background removal, normalization, and Fourier transforms are discussion-worthy. In fact, DEMETER goes to great lengths to assure that you do not need to ever worry about having to explicitly do any of those data processing chores. Certainly methods exist for doing those data processing chores, but it should never be necessary to call them explicitly. (If you find a case where you need to do so, please consider that as a bug and report it to Bruce.)
DEMETER keeps track of the state of the Data object and will re-perform data processing steps as necessary. For example, if you change the value of one of the back-Fourier transform range attributes, DEMETER will know that the back-transform must be recomputed the next time the χ(q) data is in some way used. Similarly, if a background removal attribute is changed, then DEMETER will know that all steps of data processing must be re-done.
DEMETER is also aware of what data processing steps must be up-to-date in order to properly perform any method, including plotting. Thus if you do this:
$data -> plot('R');
DEMETER knows to check whether the background removal, normalization, and forward transform are up to date and to perform them if they are not.
Plotting in the four spaces is quite straightforward:
- plot in energy
$data->plot('E');
- plot in k
$data->plot('k');
- plot in R
$data->plot('R');
- plot in back-transform k
$data->plot('q');
There are also a number of pre-defined, specialty plots.
Todo
Show biquad plot
- plot the magnitude and real part of chi(R)
$data->plot('rmr');
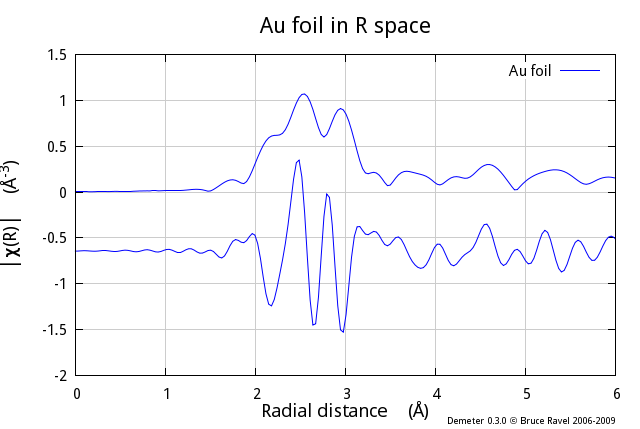
Fig. 2.1 The “rmr” plot displays a stack plot with the magnitude and real part of χ(R).
- plot chi(k) with k-weights of 1, 2, and 3, scaled to be the same size
$data->plot('k123');
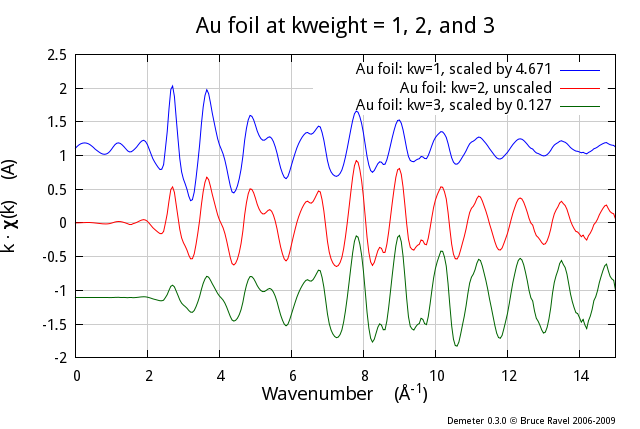
Fig. 2.2 The “k123” plot displays a stack plot with the χ(k) weighted by k1, k2, and k3. The k1 and k3 plots are scaled to be about the same size as the k2 plot.
- plot chi(R) with k-weights of 1, 2, and 3, scaled to be the same size
$data->plot('R123');
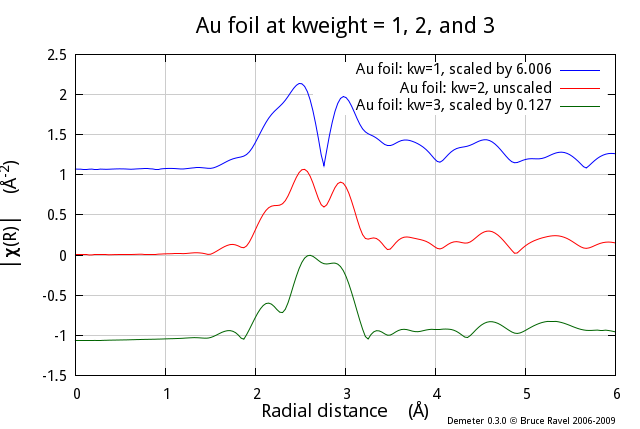
Fig. 2.3 The “r123” plot displays a stack plot with the χ(R) with the Fourier transforms made with k1, k2, and k3 weighting. The k1 and k3 plots are scaled to be about the same size as the k2 plot.
- plot in chi(k) with the real part of chi(q)
$data->plot('kq');
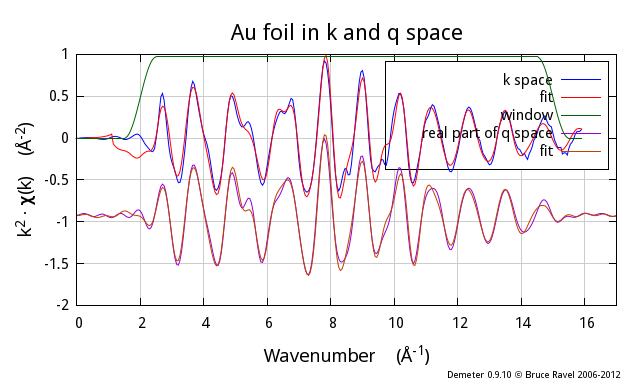
Fig. 2.4 The “k123” plot displays χ(k) and the real part of χ(q) overplotted.
- quad plot with data in all four spaces
$data->plot('quad');
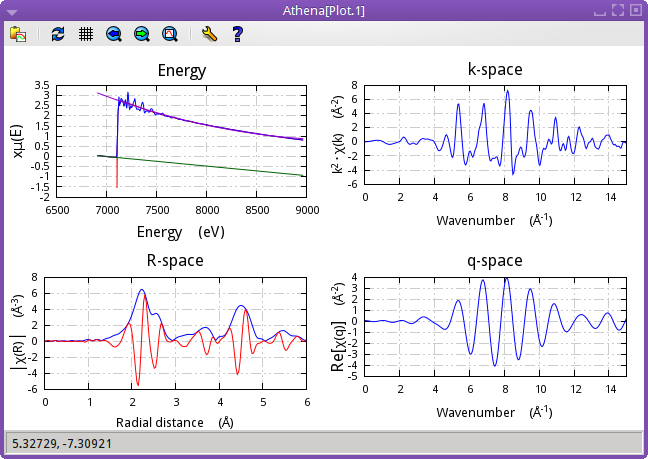
Fig. 2.5 This quad plot shows data on an Fe foil in all four spaces. The current value of k-weighting in the Plot object is used in this kind of plot. This kind of plot cannot be made with the pgplot plotting backend.
There are two more pre-packaged plot types which are specifically about visualizing merged data and its standard deviation:
$data->plot('stddev');
$data->plot('variance');
See the section on merged data for details of those two plot types.
Finally, it is plossible to plot χ(k) data in energy. This is done by
setting the chie attribute of the Plot object to a true value. When
that attribute is true and the data are plotted in k, the x-axis values
will instead be absolute energy.
$data -> po -> set(kweight => 2, space => 'k', chie => 1);
$data -> plot;
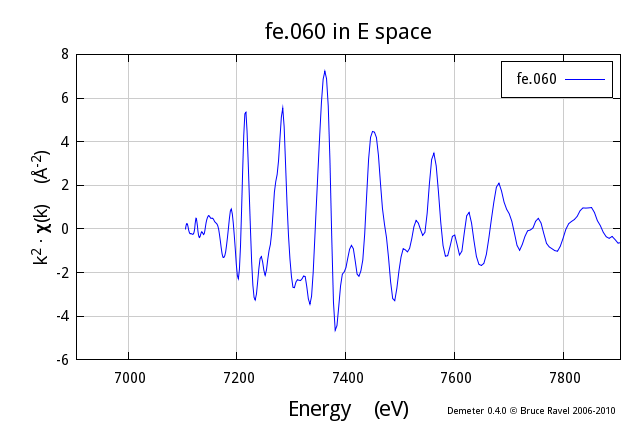
Fig. 2.6 χ(k) plotted in energy.
Note
The argument of the plot method is case insensitive.
Little attempt is made to glean meaning from that argument. If it
is not one of the strings shown above, the plot method will
likely return an error.
2.8.2. Plotting and overplotting
The plot method typically will overplot data, that is add a new
trace to the existing plot. If you wish to start a new plot, you must
explicitly do so, as shown on line 8 of this example.
1 2 3 4 5 6 7 8 9 | #!/usr/bin/perl
use Demeter;
my $prj = Demeter::Data::Prj -> new(file=>'iron_data.prj');
my ($data1, $data2) = $prj -> records(1,2);
$_ -> plot('k') foreach ($data1, $data2);
sleep 3;
$data1 -> po -> start_plot;
$_ -> plot('R') foreach ($data1, $data2);
|
The quad plot is an exception, however. There is an implicit
start_plot when a quad plot is made.
The details of the funny syntax using the po method is explained in
the section on the Plot object.
2.8.3. The singlefile plotting backend
Although the Gnuplot and PGPLOT plotting backends work just fine, sometimes you would like to be able to replicate a particular plot in another plotting program. To that end, DEMETER provides a special plotting backend called the “SingleFile” backend. This will replicate a plot form of a column data file. The data in those columns include whatever y-offsets, energy shifts, or scaling factors were included in the plot. The plot can then be replicated in another program simply by importing and plotting the columns.
Here is an example. The fit is the standard copper fit. At the end, the data, the fit, the window, and the paths are plotted usin the gnuplot backend. Then, at line 67, the “SingleFile” backend is used to output that plot to a file.
1 2 3 4 5 6 7 8 9 10 11 12 13 14 15 16 17 18 19 20 21 22 23 24 25 26 27 28 29 30 31 32 33 34 35 36 37 38 39 40 41 42 43 44 45 46 47 48 49 50 51 52 53 54 55 56 57 58 59 60 61 62 63 64 65 66 67 68 69 70 71 72 73 74 75 76 77 78 | #!/usr/bin/perl
use Demeter qw(:ui=screen);
print "Sample fit to copper data demonstrating the singlefile plotting backend.\n";
my $data = Demeter::Data -> new();
$data->set_mode(screen => 0, backend => 1);
$data ->set(file => "../../cu/cu10k.chi",
fft_kmin => 3, fft_kmax => 14,
fit_space => 'r',
fit_k1 => 1, fit_k3 => 1,
bft_rmin => 1.6, bft_rmax => 4.3,
fit_do_bkg => 0,
name => 'My copper data',
);
my @gds = (Demeter::GDS -> new(gds => 'guess', name => 'alpha', mathexp => 0),
Demeter::GDS -> new(gds => 'guess', name => 'amp', mathexp => 1),
Demeter::GDS -> new(gds => 'guess', name => 'enot', mathexp => 0),
Demeter::GDS -> new(gds => 'guess', name => 'theta', mathexp => 500),
Demeter::GDS -> new(gds => 'set', name => 'temp', mathexp => 300),
Demeter::GDS -> new(gds => 'set', name => 'sigmm', mathexp => 0.00052),
);
my $feff = Demeter::Feff->new(file=>'../../cu/orig.inp', screen=>0, workspace=>'temp/');
$feff -> rmax(5);
$feff -> run;
my @sp = @{ $feff->pathlist };
my @paths = ();
foreach my $i (0 .. 4) {
$paths[$i] = Demeter::Path -> new();
$paths[$i]->set(data => $data,
sp => $sp[$i],
s02 => 'amp',
e0 => 'enot',
delr => 'alpha*reff',
sigma2 => 'debye(temp, theta) + sigmm',
);
};
my $fit = Demeter::Fit -> new(gds => \@gds,
data => [$data],
paths => \@paths
);
$fit -> fit;
## plot normally using gnuplot
$data->po->set(plot_data => 1, plot_fit => 1,
plot_bkg => 0, plot_res => 0,
plot_win => 1, plot_run => 0,
kweight => 2,
r_pl => 'm', 'q_pl' => 'r',
);
$data->po->space('R');
$data -> plot_with('gnuplot');
my $step = 0; # stack the plot interestingly...
foreach my $obj ($data, @paths,) {
$obj -> plot;
$step -= 0.8;
$data -> y_offset($step);
};
$data -> y_offset(0);
$data -> pause;
## replicate that plot in a single file
$data->plot_with('singlefile'); # 1: switch to single file backend
$data -> po -> prep(file=>'nifty_plot.dat', standard=>$data, space=>'R');
$step = 0;
foreach my $obj ($data, @paths,) { # 5: make the plot
$obj -> plot;
$step -= 0.8;
$data -> y_offset($step);
};
$data -> y_offset(0);
$data -> po -> finish;
$data -> unset_standard;
|
Note that at line 68, some additional information is provided to make the SingleFile output, including the name of the output file. A Data object with data included in the file is set as the SingleFile standard. The x-axis in the file will be the x-axis of that Data object. in the case of a plot in energy, all other data will be interpolated onto that energy grid.
The plot is then remade at lines 70-76. The finish method is called
at line 77 to actually write out the file. It is good practice to unset
the standard, as at line 78, to avoid future confusion.
The prep method at line 68 is a convenience method which does the
following:
$data->po->space('R');
$data->standard;
$data->po->file('nifty_plot.dat');
$data->po->start_plot;
2.8.4. Other odds and ends
The plotkey atribute of the Data object is a convenient way to
override the label of a plotted object. Normally, the name attribute
is used for this purpose, but it is sometimes useful to not rename an
object but still provide a specific bit of text to use as a plotting
label.
DEMETER is copyright © 2009-2016 Bruce Ravel – This document is copyright © 2016 Bruce Ravel
This document is licensed under The Creative Commons Attribution-ShareAlike License.
If DEMETER and this document are useful to you, please consider supporting The Creative Commons.