9.2. Aligning data groups
Aligning data is the process of moving a data group in energy onto an absolute energy grid defined by some standard. In ATHENA that standard is chosen fairly arbitrarily – it is simply one of the other groups in the group list. The alignment is done by adjusting the «Energy shift» parameter.
This adjustment can be done simply by manually editing the «Energy shift» parameter, but tools exist on the alignment tool, shown below, to make this somewhat easier.
New in version 0.9.18,: a control was added to display the uncertainty in the energy shift. This value can be displayed via the context menu attached to the «Energy shift» label on the main page.
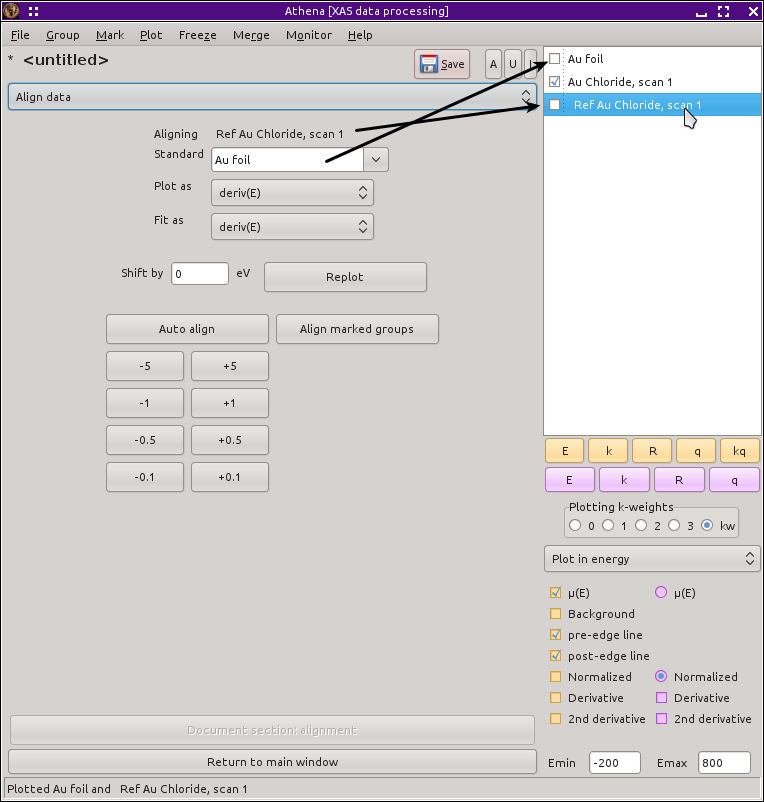
Fig. 9.4 The data alignment tool.
There are several variations on how the alignment is performed and visualized. As the alignment proceeds, it can be plotted as μ(E), normalized μ(E), the derivative of μ(E) (as shown in the next plot), or the smoothed derivative of μ(E). A three-point smoothing function is applied three times to the derivative of the μ(E) if that plotting option is selected.
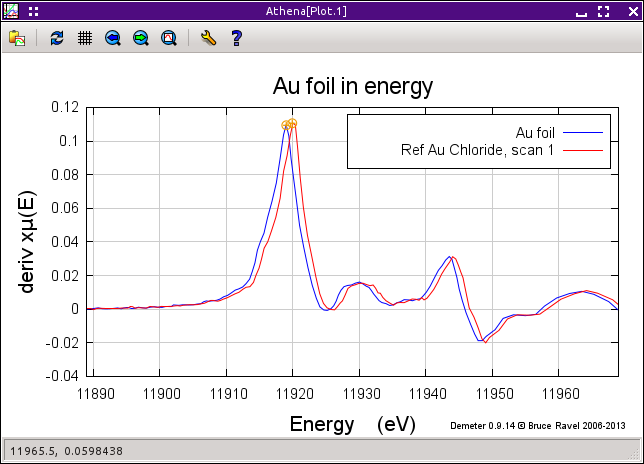
Fig. 9.5 As you work on aligning your data, the current data group is plotted along with the standard. This gives you visual feedback on how well your data are aligned.
The alignment is always done by moving the current data group and keeping the standard fixed. The standard is selected from the menu at the top of the tool. This menu contains the entire contents of the group list, excluding those groups that cannot be plotted in energy.
You can perform the alignment by hand by clicking any of the buttons labeled with numbers. Those buttons will move the current group up or down in energy by the amount on the button's label. Alternately, you can type an energy shift value in the box that displays the current value of «Energy shift». You can click these buttons until the data line up nicely.
Clicking the Auto align button performs a simple fit in an attempt to align your data to the standard. The fit is evaluated over an energy range from 50 volts below the edge to 100 volts above. The parameters in the fit are an energy shift and an overall scaling term. The function minimized is the difference between the derivative of the standard and the derivative of the current group modified by the fitting parameters. The energy shifted data is interpolated onto the energy grid of the standard for the fit.
This algorithm works quite well for data that are fairly clean and are misaligned by less than 5 or 10 volts. For noisy data, the fit may be more successful if you choose to fit smoother data by selecting that option from the menu labeled Fit as:. For very misaligned data, you may need to manually set an approximate value for «Energy shift» before clicking the Auto align button.
You can apply the automated alignment algorithm to many groups in sequence. First mark all the groups that need to be aligned, then click the button that says Align marked groups. This may take a few minutes, depending on how many groups you have marked, but at the end hopefully all of your data will be nicely aligned.
This alignment algorithm is the same as the one used by the preprocessing feature of the column selection dialog.
If you have imported a reference channel with your data, you can use this tool to align the reference channels. This puts your real data on a proper absolute energy grid, which is very important for comparing edge energies in XANES studies.
Caution
It is very important to align your data well. Many other parts of ATHENA assume that you have already done a good job of aligning the data. Merging and linear combination fitting are examples of this.
A common approach to processing data that I use is to import a first scan and to decree that one as the standard. I will calibrate the reference channel of that first scan. That puts the reference of the first scan at its proper place on an absolute energy scale. Once that is calibrated, I will import the rest of my data from that series of measurements and also import a reference channel for each one. I will then align each of the reference channels to the reference channel of my designated standard. If the data is of high quality, I will typically use the pre-processing feature while importing all of my data. In many cases, following this procedure and trusting the automated alignment is sufficient to prepare my data for merging and further analysis.
DEMETER is copyright © 2009-2016 Bruce Ravel – This document is copyright © 2016 Bruce Ravel
This document is licensed under The Creative Commons Attribution-ShareAlike License.
If DEMETER and this document are useful to you, please consider supporting The Creative Commons.