15.7. Empirical standards
Let me just say up front that ARTEMIS is intended as a front-end to FEFF for the problem of EXAFS analysis. In almost all cases, FEFF is the right tool for that job and there are few cases where the use of empirical standards is preferable to using FEFF. As discussed elsewhere in this manual, there are a situations where the application of FEFF to a particular problem may not be obvious. Any situation for which the choice of a starting configuration of atomic coordinates, as needed for FEFF's input data, is not obvious might fall into that category. In one of those situations, you might be tempted to puruse empirical standards. You would, however, usually be better served by adopting one of the strategies that have been developed for applying FEFF calculations to unknown structures.
That said, there are a small handful of situations where the use of empirical standards is justified. In fact, I can think of two. The situation where an absorber and a scatterer are bound by a hydrogen atom – i.e. there is a hydrogen atom in the space between the absorber and scatterer from which the photoelectron might scatter – is poorly handled by FEFF. In that case, finding a suitable empirical standard will likely be an improvement over the systematic error introduced by FEFF's poor handlng of the hydrogen. The second example would be a heterogeneous sample – like a soil – which contains a component which varies little from sample to sample. In that case, using an emirical standard to represent the unchanging component and using FEFF to model the behavior of the component(s) which do change across the ensemble of measurements might be a fruitful strategy.
To this end, DEMETER offers a mechanism for generating an empirical standard from measured data. This is saved in a form that can be used by ARTEMIS as if it were a normal path imported into the fit in the normal way.
My example will use the copper foil data at 10 K and 150 K, which can be found at at my Github site. In order to demonstrate the gneration and use of an empirical standard, I will use the uncomplicated example of using the low temperature data as the standard for the analysis of the higher temperature data. Of course, a real-world scenario will be much more complicated that this example, but it should demonstrate the mechanics of making and using the empirical standard.
15.7.1. Preparing the empirical standard
It starts by processing the data properly. First, import the two data sets into ATHENA. Take care that the data are aligned and have the same values for E0. Choose a k-range over which both data sets are of good quality. I have chosen a range of 3 Å-1 to 12 Å-1. Then choose an R-range to enclose and isolate the first peak, which corresponds to the first coordination shell. Here, I chose 1.8 Å to 2.8 Å.
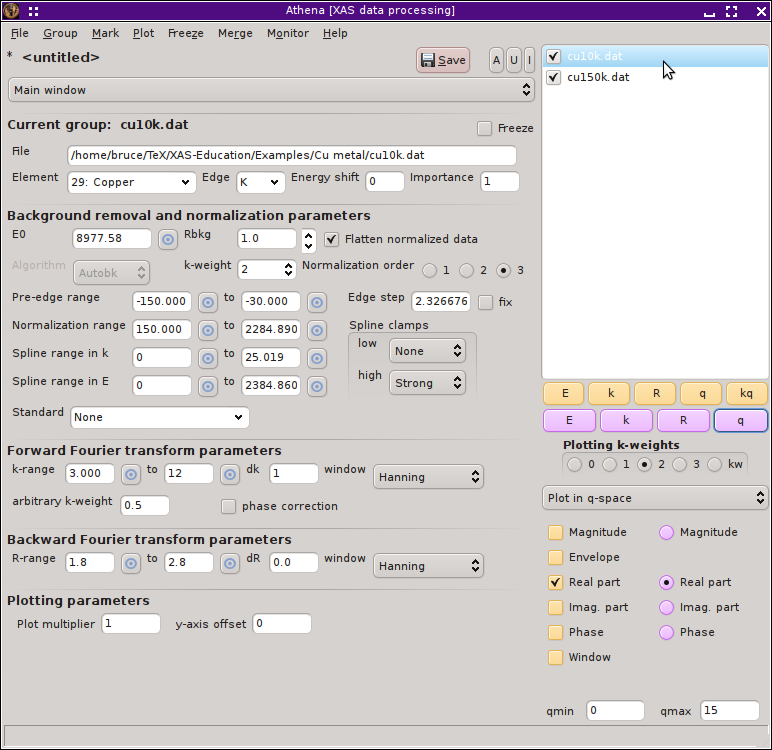
Fig. 15.19 The Cu foil data at two temperatures have been imported into Athena, aligned, and processed.
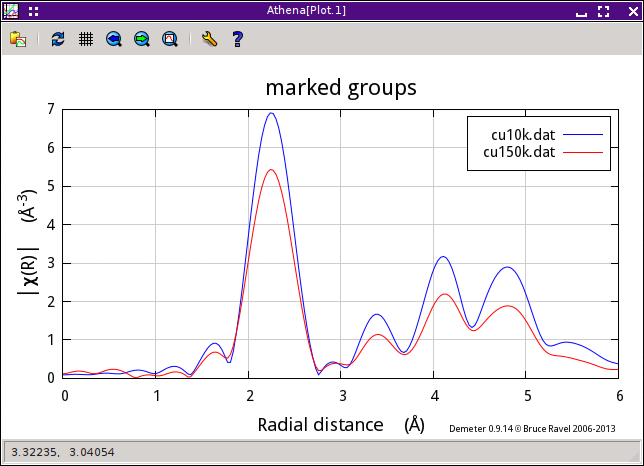
Fig. 15.20 Here are the Cu foil data at the two temperatures plotted in R-space ...
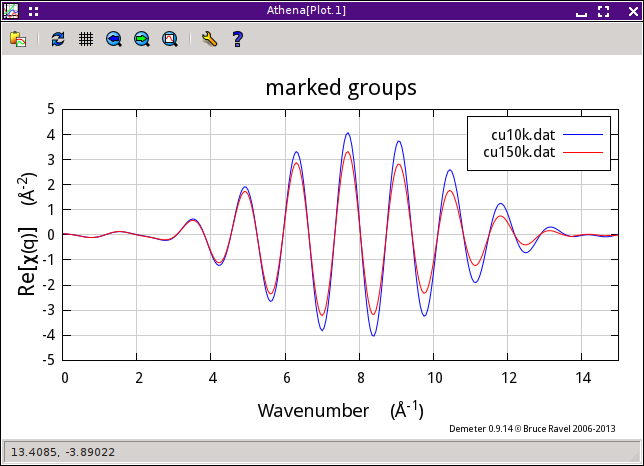
Fig. 15.21 And plotted in back-transform k-space
Select the data set from which you wish to make an empirical standard, in this case the data measured at 10 K. Select the submenu. One of the options is to export an empirical standard.
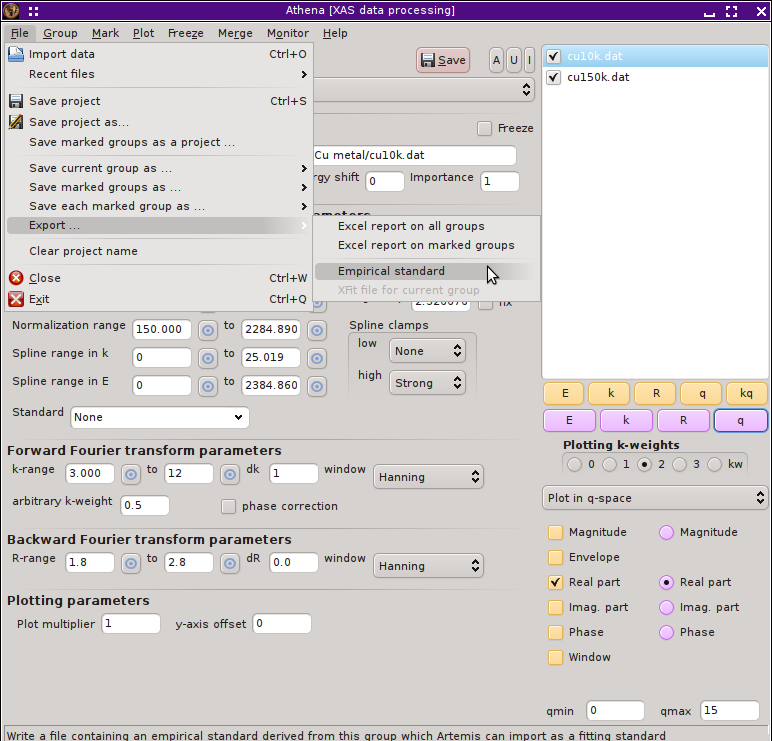
Fig. 15.22 Exporting the processed data as an empirical standard.
This will prompt you for a file name using the standard file selection dialog. The default file is the name of the data group with .es as the extension. It will then prompt you for the species of the scattering element using a periodic table dialog. ATHENA has no way of knowing the scatterer species, so you have to provide this information. In this case, you would click on Cu since this is a copper foil.
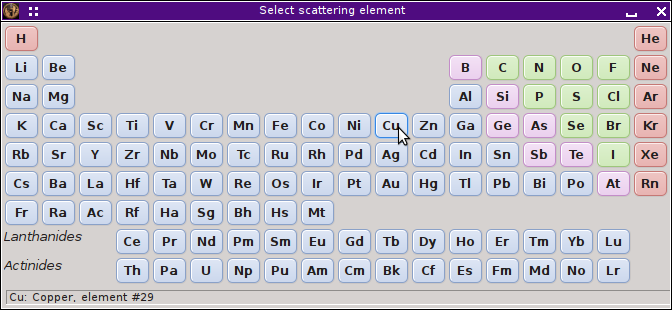
Fig. 15.23 Select the species of the scatterer from the periodic table interface.
15.7.2. Using the empirical standard
Now fire up ARTEMIS and import the 150 K data from the ATHENA project file you saved before closing ATHENA. (You did save your work, didn't you?!) The k- and R-ranges will be imported as they were set in ATHENA. To begin the analysis using the empirical standard, click on the hot text indicated in the figure below. You can also import this sort of standard from the menu.
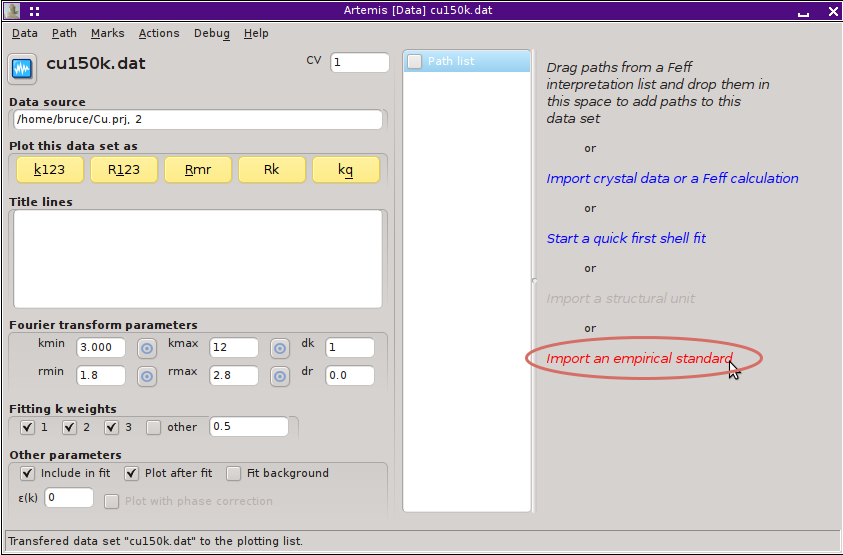
Fig. 15.24 The 150 K data have been imported into Artemis and we are ready to import the prepared empirical standard.
Once the empirical standard is imported, it will be displayed just like a normal path. You can tell it is an empirical standard because its label contains the token [Emp.].
Here I have set up a 4-parameter fit typical for a first shell analysis, except that I have set the E0 parameter to 0. The amplitude, σ2, and ΔR are guess parameters.
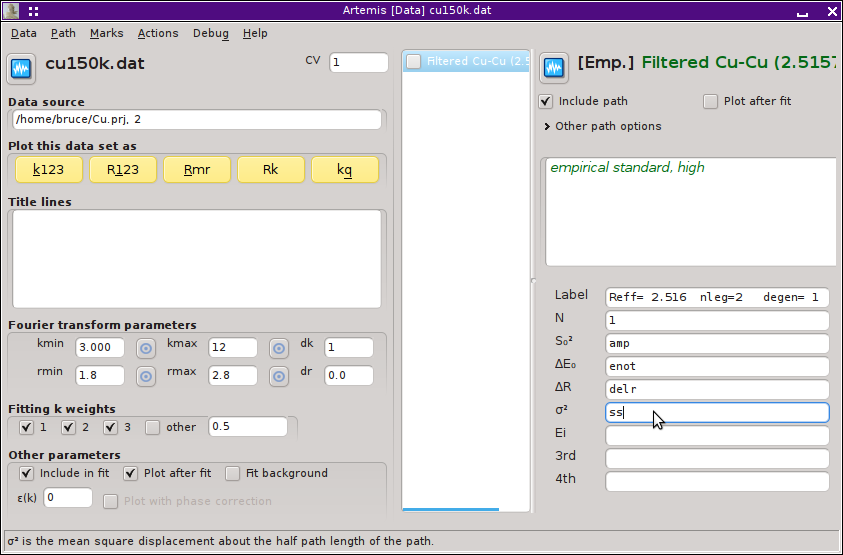
Fig. 15.25 The 150 K data and the empirical standard have been imported into Artemis.
We are now ready to hit the Fit button. Shown below are the results of the fit with the fitting space chosen first as R, then as q.
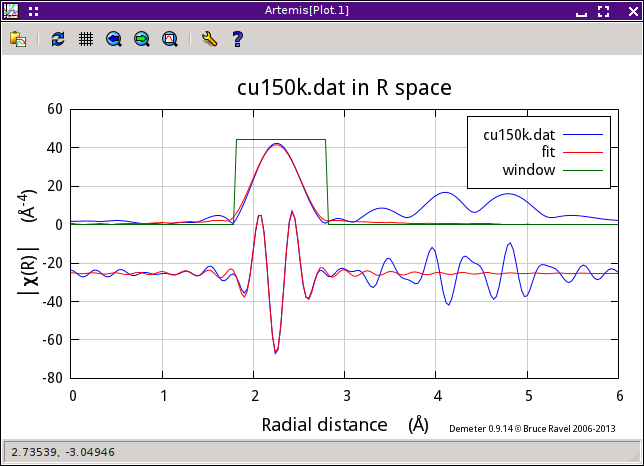
Fig. 15.26 The fit with the fitting space selected as R and the plot displayed in R.
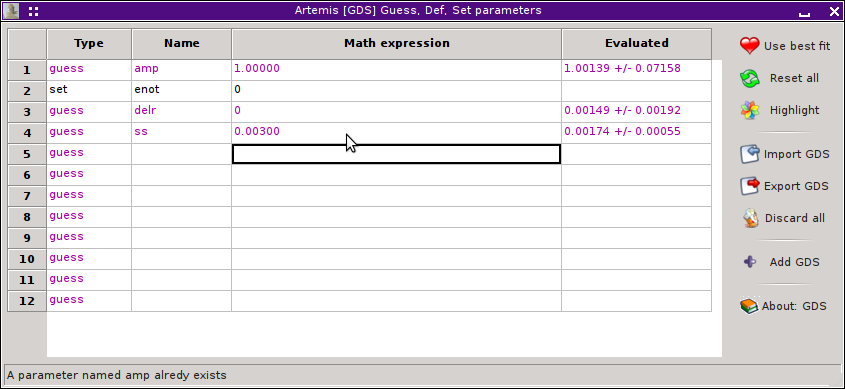
Fig. 15.27 The parameter values from the fit inR.
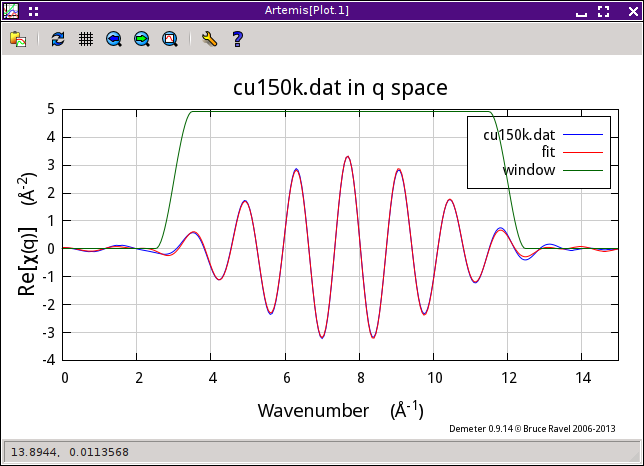
Fig. 15.28 The fit with the fitting space selected as q and the plot displayed in q.
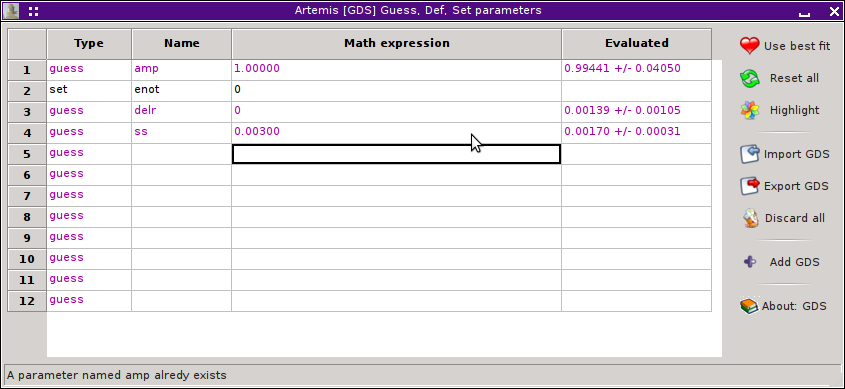
Fig. 15.29 The parameter values from the fit in q.
The results fitting in R or q are pretty similar, which is reassuring.
The value for the amplitude is consistent with and close to 1, which is should be since the copper metal is 12-fold coordinate at both temperatures.
The value for the change in σ2 is 0.0017±3, which seems reasonable for this change in temperature.
The value for ΔR fitted in q space is 0.001±1. Fitted in R space, the uncertainty is 0.002. That's kind of interesting. In either case, the uncertainty in R is smaller than for a FEFF-based fit for a number of reasons. Probably the most significant is that both standard and data are of excellent quality. Were the data the sort of marginal data that comes from most research problems on difficult materials, the effects of statistical and systematic noise would be much more dramatic. Also relevant to the small uncertainty is that this fitting problem has been contrived (by virtue of careful alignment and choice of E0 back in ATHENA) to remove the fitted change in E0 from the problem. By removing the parameter most correlated with ΔR, we significantly reduces the uncertainty in ΔR.
I would not interpret all of this to mean that use of empirical standards is superior to the use of FEFF. In the specific case where the first coordination shell is of known contents and can be well isolated from higher shells and where you are confident that your unknown is identical to your standard except for small changes in N, R, or σ2, then empirical standards are a useful tool for your EXAFS toolbox.
DEMETER is copyright © 2009-2016 Bruce Ravel – This document is copyright © 2016 Bruce Ravel
This document is licensed under The Creative Commons Attribution-ShareAlike License.
If DEMETER and this document are useful to you, please consider supporting The Creative Commons.