5.1. Plotting space tabs
5.1.1. Plotting in energy
The appearance of the plots made in E-, k-, R-, or q-space are controlled by the contents of the plot options tabs in the lower right hand corner of ATHENA. This is highlighted in the following figure.
In energy, you have the option of plotting μ(E) normalized or not and derivative or not. The orange buttons on the left control how the current group is plotted. The purple buttons on the right control how marked groups are plotted. For the current group, you also have the option of plotting the background function, the pre-edge line, or the post-edge polynomial. As discussed in the normalization section, it is very helpful to examine the pre- and post-edge lines to verify that data normalization is done correctly.
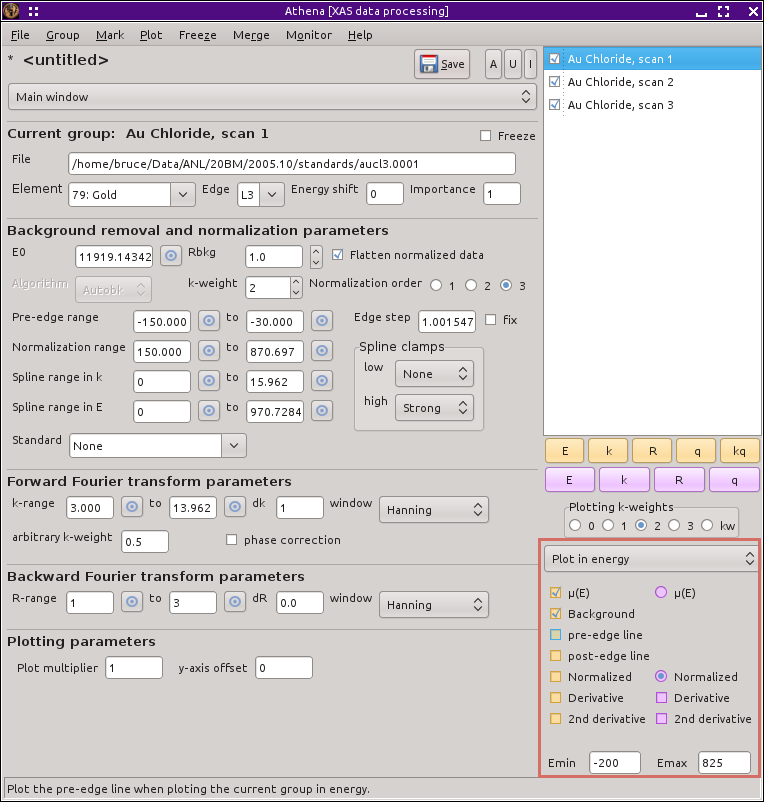
Fig. 5.1 The plot options section with the energy tab showing.
The two text entry boxes at the bottom of the tab are used to determine the extent of the data range plotted on the x-axis. Both those these numbers are relative to «e0». The ♦Plot→emin and ♦Plot→emax preferences can be used to set the default plot range. See also the plot styles section.
5.1.2. Plotting in k-space
The plot of χ(k) is mostly determined by the value of the plotting k-weight buttons. The only option on the k-space tab is to make the plot as k-weighted χ(E) rather than χ(k). For the χ(E) plot, the k-axis is translated to absolute energy using the value of «e0».
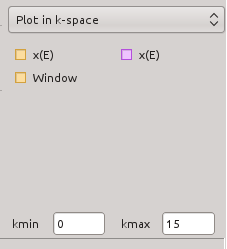
Fig. 5.2 The k tab.
If the window button is checked, the windowing function used to make the forward Fourier transform will be plotted along with the plot for the current group.
The two text entry boxes at the bottom of the tab are used to determine the extent of the data range plotted on the x-axis. Although either number can be a negative value, there is no data below k=0. The ♦Plot→kmin and ♦Plot→kmax preferences can be used to set the default plot range. See also the plot styles section.
5.1.3. Plotting in R-space
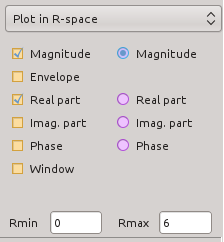
Fig. 5.3 The R tab.
The plot of χ(R) is determined in part by the value of the plotting k-weight buttons. The options in the tab tell ATHENA which part of the complex χ(R) to plot. For the current group, the parts are inclusive. Each selected part is plot.
For the current group, you also have the option of plotting the envelope, which is the magnitude plotted in the same color as the negative magnitude. Selecting the envelope deselects the magnitude and vice versa. For marked groups, the parts are plotted exclusively and the envelope is not available.
The two text entry boxes at the bottom of the tab are used to determine the extent of the data range plotted on the x-axis, behave much like the same boxes on the k tab, and have similar preferences.
When the phase correction button is clicked on, the Fourier transform for that data group will be made by subtracting the central atom phase shift. This is an incomplete phase correction – in ATHENA we know the central atom but do not necessarily have any knowledge about the scattering atom.
Note that, when making a phase corrected plot, the window function in R is not corrected in any way, thus the window will not line up with the central atom phase corrected χ(R).
5.1.4. Plotting in q-space
The letter q is used to denote wavenumber of the filtered χ(k)
function and to avoid confusion with unfiltered k-space. The units of
q are inverse Angstroms, just as for k.
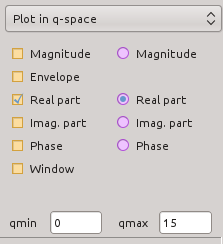
Fig. 5.4 The q tab.
The plot of χ(q) is determined in part by the value of the plotting k-weight buttons. The options in the tab tell ATHENA which part of the complex χ(q) to plot. For the current group, the parts are inclusive. Each selected part is plot.
For the current group, you also have the option of plotting the envelope, which is the magnitude plotted in the same color as the negative magnitude. Selecting the envelope deselects the magnitude and vice versa. For marked groups, the parts are plotted exclusively and the envelope is not available.
If the window button is checked, the windowing function used to make the forward Fourier transform will be plotted along with the plot for the current group.
The two text entry boxes at the bottom of the tab are used to determine the extent of the data range plotted on the x-axis, behave much like the same boxes on the k tab, and have similar preferences.
DEMETER is copyright © 2009-2016 Bruce Ravel – This document is copyright © 2016 Bruce Ravel
This document is licensed under The Creative Commons Attribution-ShareAlike License.
If DEMETER and this document are useful to you, please consider supporting The Creative Commons.