High energy resolution fluorescence detection (HERFD)
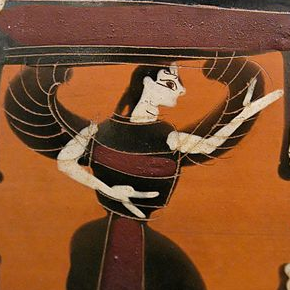
Here is an example of a high energy resolution fluorescence detection (HERFD) measurement of the Pt LIII edge using the Lα1 emission line. This montage shows a sequence of 112 exposures of the Pilatus through the energy range of the Pt LIII XANES measurement.
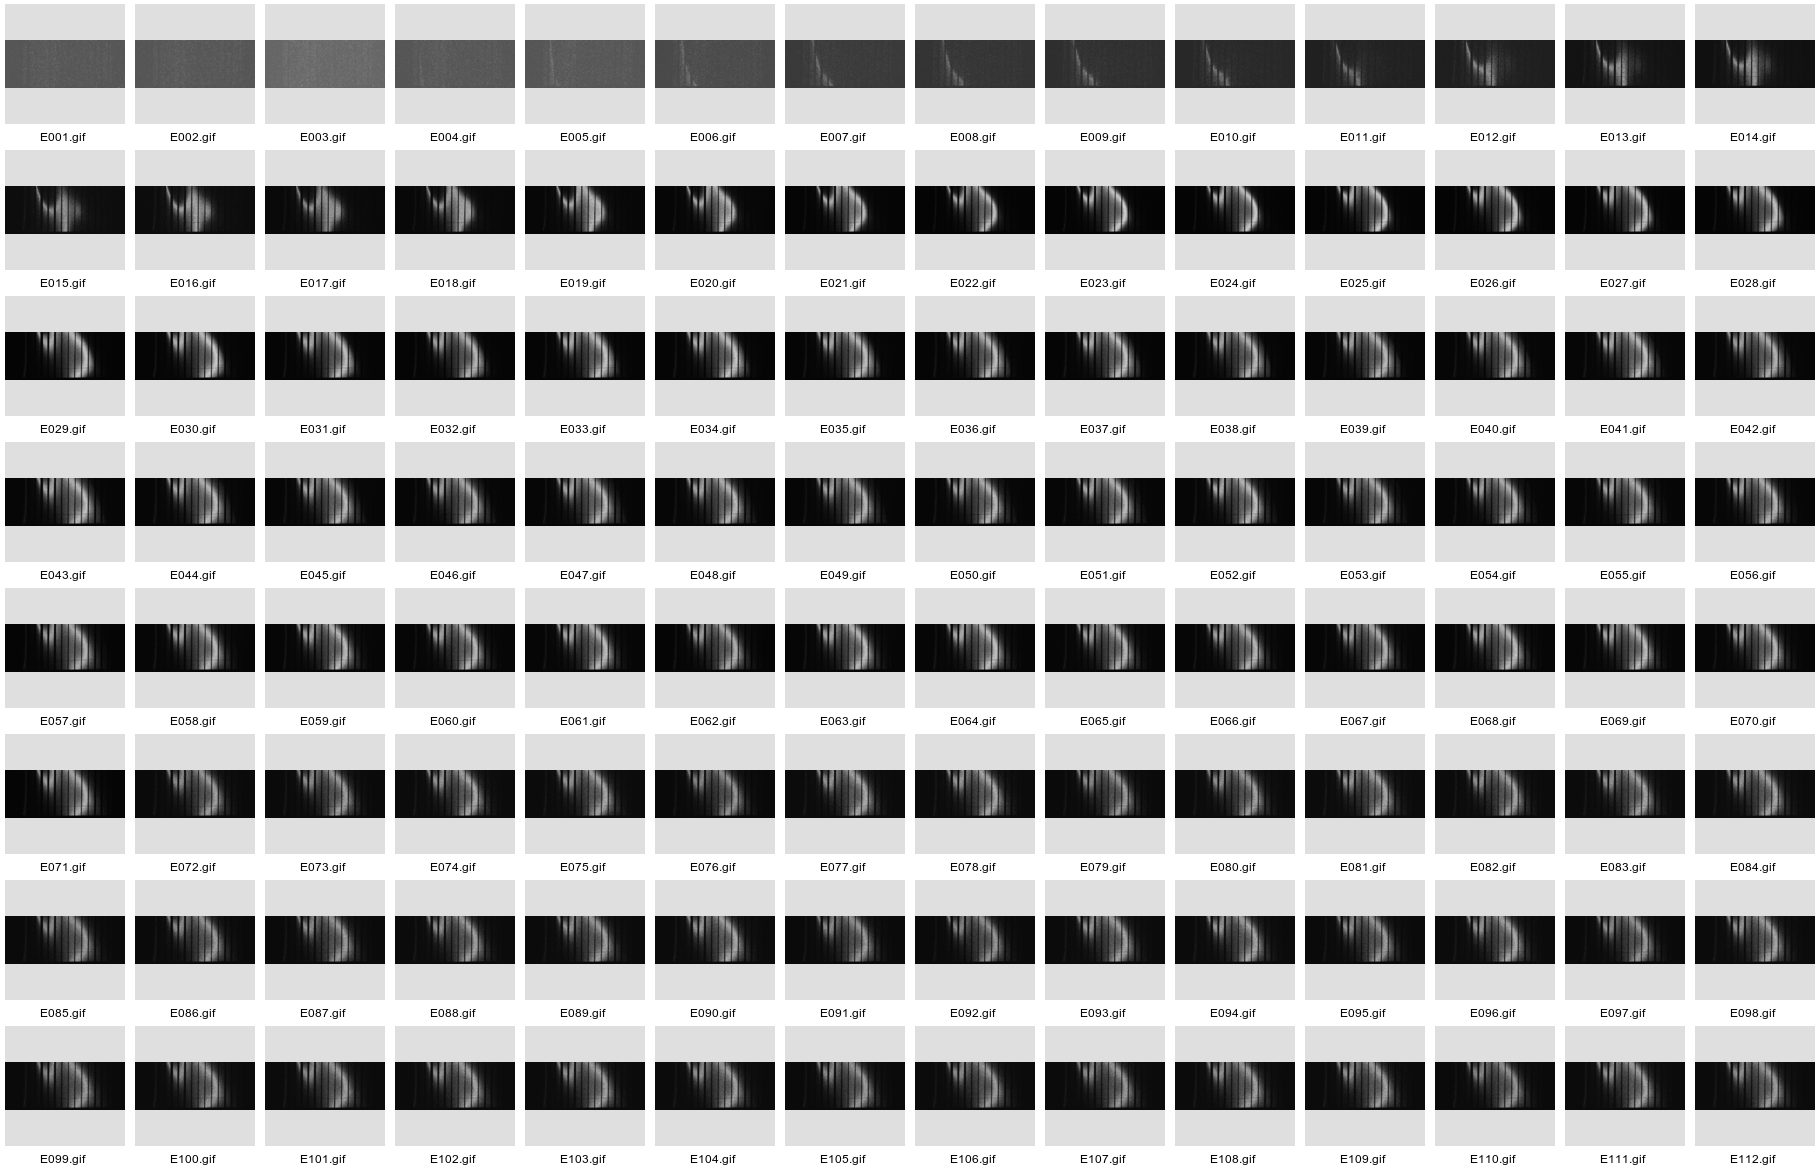
The HERFD measurement sequence for the Pt LIII edge using the Lα1 emission line.
At some level, it is clear how this is a XANES spectrum. The first few exposures are below the edge. There is no fluorescence below the edge, so there little signal on the face of the detector. As the monochromator is scanned above the edge, the signal on the detector grows. Through the XAFS oscillations, the intensity of the signal on the detector varies.
To convert these images into a spectrum, it is necessary to create a map which translates a pixel location on the detector into an energy. That is, the crystal disperses energy over the face of the detector. To compute the HERFD signal, we want to include only that portion of each image which corresponds to a narrow energy band around the Lα1 peak energy of 9442 eV.
To do this, we measure an “elastic image” at 9442 eV. The elastically scattered photons at this energy are dispersed by the Laue analyzer onto specific pixels of the detector. These images are used to make a mask that associates those illuminated pixels with the energy 9442 eV.
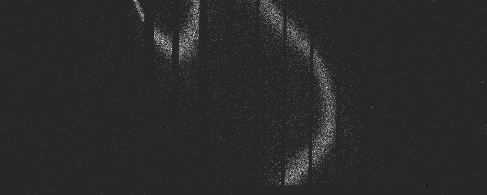
The measurement of the elastic scattering at 9442 eV, the peak of the Lα1 emission line.
The mask creation algorithm has a lot to deal with, as you can see from the elastic montage. The mask creation has to reject weakly illuminated pixels on the periphery of each image, leaving only the wiggly stripe running through the middle of the each image. It also must reject very bright spots due to to powder diffraction, which occasionally occur and are often much brighter than the rest of the image.
Here is the mask generated from the elastic image at 9442 eV. The algorithm isolates those pixels which are obviously within the stripes of the elastic images, setting each of those pixels to 1, while setting all other pixels to 0.

The mask for 9442 eV, the peak of the Lα1 emission line.
This mask is then applied in sequence to the images measured throughout the range of the Pt LIII edge XANES. This is done by multiplying the mask pixel-by-pixel with each measurement in the scan. This extracts only those pixels associated with the peak of the Lα1 emission line.
The intensity of the masked pixels are summed, yielding the HERFD signal at that energy. This is repeated for each energy point, yielding the HERFD spectrum.
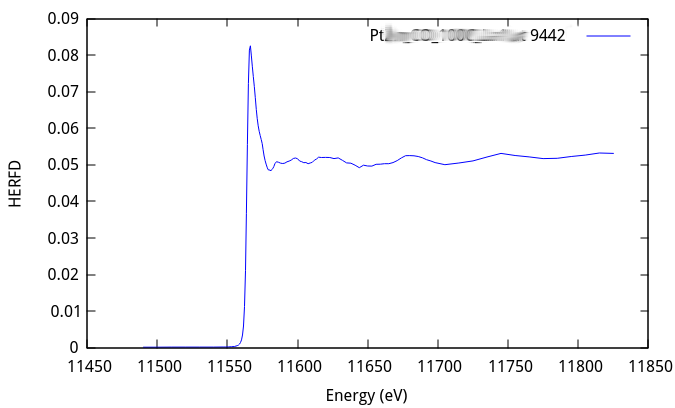
The HERFD using the 9442 eV mask.
The command for making that HERFD spectrum from the collection of images is
bla herfd -e 9442 -c PtLa1.ini Pt_La1
Here Pt_La1 is the “stub”, i.e. the word which begins the
names of all files in the measurement. The emission energy at which
to compute the HERFD is 9442 eV, specified by the -e command line
switch. The ini file defining the parameters of the calculation is
specified with the -c switch.
Here is the ini file:
[measure]
emission           = 9429 to 9454 by 1
scanfolder         = /home/bruce/Data/herfd_data
tiffolder          = /home/bruce/Data/herfd_data
outfolder          = /home/bruce/Data/NIST/herfd_data/process
element            = Pt
line               = La1
tiffcounter        = 001
energycounterwidth = 3
imagescale         = 40
outimage           = gif

[files]
scan               = %s.001
elastic            = %s_elastic_%T_001.tif
image              = %s_%c.tif
xdi                = /home/bruce/git/BLA-XANES/share/bla.xdi.ini

[steps]
steps = <<END
bad 400 weak 0
gaussian 2
andmask
END
The [measure] block defines the measured elastic energys, the
locations on input and output files, and various other parameters.
The [files] block defines mini-templates used by
Xray::BLA to construct input and output file names. The
[steps] block gives the recipe for creating the mask from the
elastic energy image.
Xray::BLA and METIS are copyright © 2011-2014, 2016 Bruce Ravel and Jeremy Kropf – This document is copyright © 2016 Bruce Ravel
This document is licensed under The Creative Commons Attribution-ShareAlike License.
If this software and its documentation are useful to you, please consider supporting The Creative Commons.