Resonant Inelastic X-ray Scattering (RIXS)
A resonant inelastic scattering measurement is viewed in two ways, in the context of the BLA spectrometer. In either case, the RIXS measurement measures over an entire plane of emission and incident energies. That is, the emission intensity is measured over a range of emission energies and over a range of incident energies.
In the context of HERFD experiment, the RIXS measurement measures the XAS-like spectra at various emission energies. Typically in HERFD, we present the XANES spectrum measured at the peak of the emission line. This produces a spectrum with E0 at the same location in the conventional and HERFD spectra. Another way of saying that is that the conventional spectrum looks like a convolution of the HERFD spectrum.
In the context of an XES measurement, the XES spectrum is measured over a range of energies, usually in the vicinity of the absorption edge. In this way, various subtle phenomena such as crystal field splitting can be measured. The output in this case is the sequence of XES spectra in a form that can be used to make a surface plot.
RIXS in the XAS direction
To make the XAS-like RIXS measurement, we generate the full sequence of masks from the full sequence of elastic energies. Each mask is made in exactly the same way as for the HERFD measurement already discussed.
The off-peak HERFD spectra are smaller than the on-peak HERFD. At the fringes of the energy range, these HERFD spectra are quite tiny.
The E0 of each HERFD spectrum depends upon the emission energy measured. This, along with increased spectral resolution of the HERFD is the result of the narrow bandwidth of the analyzer crystal.
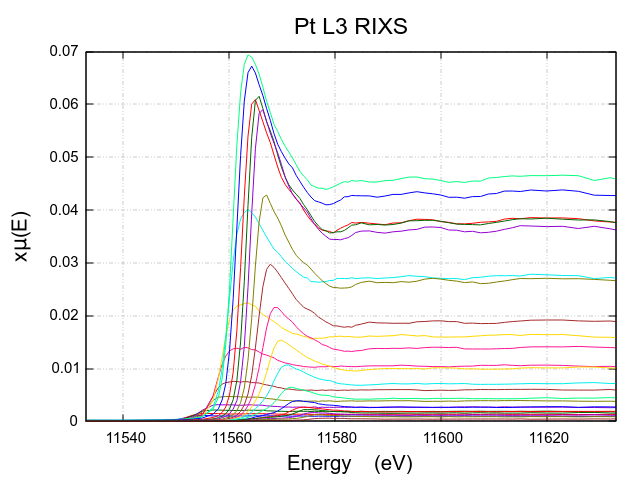
The sequence of Pt LIII edge HERFD spectra made at energies from 9429 eV to 9454 eV, an energy range spanning the Pt Lα1 emission line. The tallest spectrum is the HERFD from the peak of the emission line at 9442 eV.
This also serves to explain the relationship between the HERFD spectrum and the conventional XAS. The conventional XAS is measured without energy resolution. (In the case of solid state detection of the fluorescence spectrum, the energy resolution of the detector is substantially larger than the core-hole lifetime.) Thus the conventional XAS can be viewed as the superposition of the XAS-like RIXS spectra.
The command using the bla program is very similar to the command for making a single HERFD spectrum. In fact, all this does is iterate the HERFD command over all elastic energies.
bla rixs -c PtLa1.ini Pt_La1
The same ini file is used for the RIXS calculation as for the HERFD calculation.
RIXS in the XES direction
In this example, we consider the resonant Bi Lβ5 emission in Bi2NbO5F. This is exactly like the XES measurement already discussed, except that instead of considering the image measured at a non-resonant energy well above the absorption edge, we extract the XES spectrum from a sequence of energies around the absorption edge. If the emission line is close enough to the absorption energy, as it is in the case of the Bi Lβ5, the elastic images themselves are the images that are processed to compute each resonant XES spectrum.
Here is an example of an image measured in the range of the Bi Lβ5 line for Bi2NbO5F. The stripe at the right represents the elastic scattering. This is the part of the image that is used to make the mask for this energy. The more diffuse stripe at the left is the signal from the Lβ5 line, which is beginning to appear as the incident energy approaches the edge energy. The sequence of masks made from the elastic portions of these images are passed over each entire image.
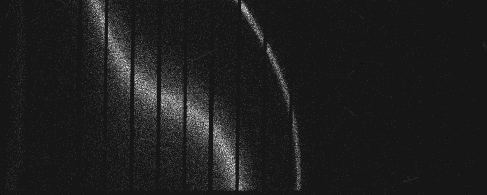
The image measured for Bi2NbO5F at 13427 eV, within the range of the RIXS measurement. The elastic scattering is the thin stripe to the right, the RIXS signal is the more diffuse area to the left.
Here is the result, the sequence of XES spectra presented as a surface plot of incident energy versus energy loss. Energy loss is emission energy minus incident energy.
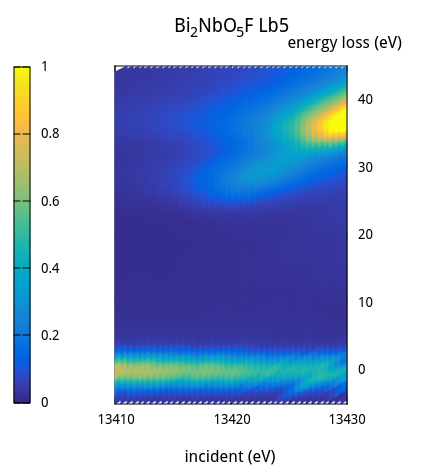
The RIXS plane for the Bi Lβ5 emission line in Bi2NbO5F.
The bright stripe at 0 energy loss is the elastic portion of each image. That is, the 0 energy loss stripe is from passing the masks over the elastically scattered portion of each image in the sequence.
The signal above 20 eV energy loss results from passing the elastic masks over the more diffuse Lβ5 signal on the right side of each successive image.
In this case, we see the beginning of the XAS in the bright yellow spot in the upper right corner of the RIXS plane. The more diffuse signal in the upper half of the plane is some kind of crystal field splitting (or some such thing! I don't really understand it at the time I am writing this).
The command using the bla program is very similar to the command for computing a single XES spectrum. Instead of specifying the image to process, all images in the sequence are iterated over.
bla plane -c ini/BNOF.ini --noscan Bi2NbO5F_Lb5_v
Note that the same ini file is typically used for the XES and plane measurements. Here is the one used for this Bi Lβ5 measurement.
[measure]
emission           = 133660 to 134345 by 5
line               = Lb5
scanfolder         = /home/bruce/Data/NIST/10ID/2016.02/Bi2NbO5F_v
tiffolder          = /home/bruce/Data/NIST/10ID/2016.02/Bi2NbO5F_v
outfolder          = /home/bruce/Data/NIST/10ID/2016.02/Bi2NbO5F_v/processed
element            = Bi
tiffcounter        = 0001
energycounterwidth = 4
imagescale         = 40
outimage           = gif

[files]
scan               = %s.001
elastic            = %s_elastic_%e_%t.tif
image              = %s_%c.tif
xdi                = ini/bi.xdi.ini

[spots]
xrange=53 290

[steps]
steps = <<END
bad 400 weak 0
gaussian 2.5
useshield 12
polyfill
END
Xray::BLA and METIS are copyright © 2011-2014, 2016 Bruce Ravel and Jeremy Kropf – This document is copyright © 2016 Bruce Ravel
This document is licensed under The Creative Commons Attribution-ShareAlike License.
If this software and its documentation are useful to you, please consider supporting The Creative Commons.