Non-resonant X-ray Emission Spectroscopy (XES)
In this example, the non-resonant X-ray emission spectroscopy of the Kβ2,4 emission line of Nb2O5 is measured. The monochromator is moved to 19100 eV, an energy above the Nb K edge, thus exciting all the Nb Kα and Kβ emission lines.
Here is the image dispersed by the spectrometer onto the detector:
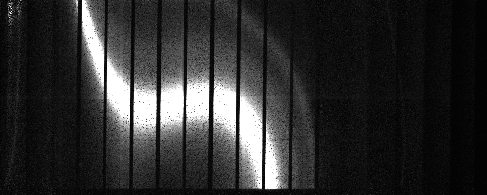
Non-resonant XES measurement of Nb2O5, measured at 19100 eV. The brightness of the image has been enhanced so that the dim features are visible.
The Kβ2 is the over-saturated stripe in this image. To the right, which is the high energy side of the image, there are two additional features associated with the Kβ'' and Kβ4 emission lines. These smaller features can be seen clearly in the processed data:
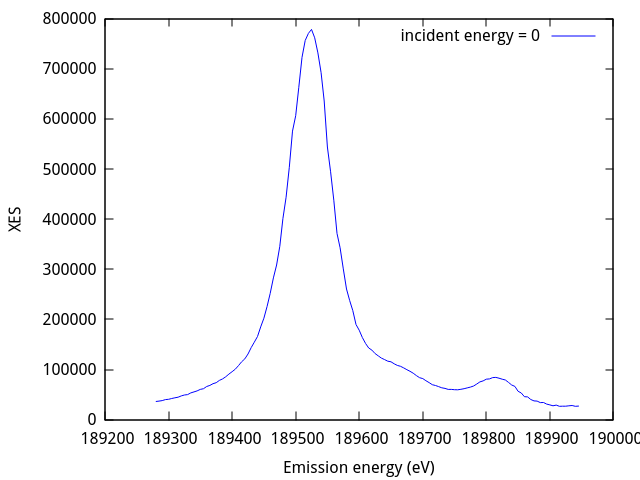
The XES spectrum of Nb2O5 extracted from the image.
To convert the image above into this spectrum, we need to translate the pixels in the image into energy. Similar to the HERFD measurement, this is done by measuring a sequence of images with the monochromator set to energies spanning the energy range of the emission line. In the case of the Nb Kβ2,4 emission line, elastic images are measured from 18928 eV to 18994.5 eV,
From each elastic image, a mask is made. Each mask, then, defines the pixels which are illuminated by photons of that energy being dispersed through the spectrometer crystal.
At each energy in the range from 18928 eV to 18994.5 eV, the mask is multiplied by the non-resonant XES image above. The illuminated pixels are summed and that sum is the emission intensity at that energy. In this way, the XES spectrum is constructed.
Here are the masks at each energy through the emission peak.
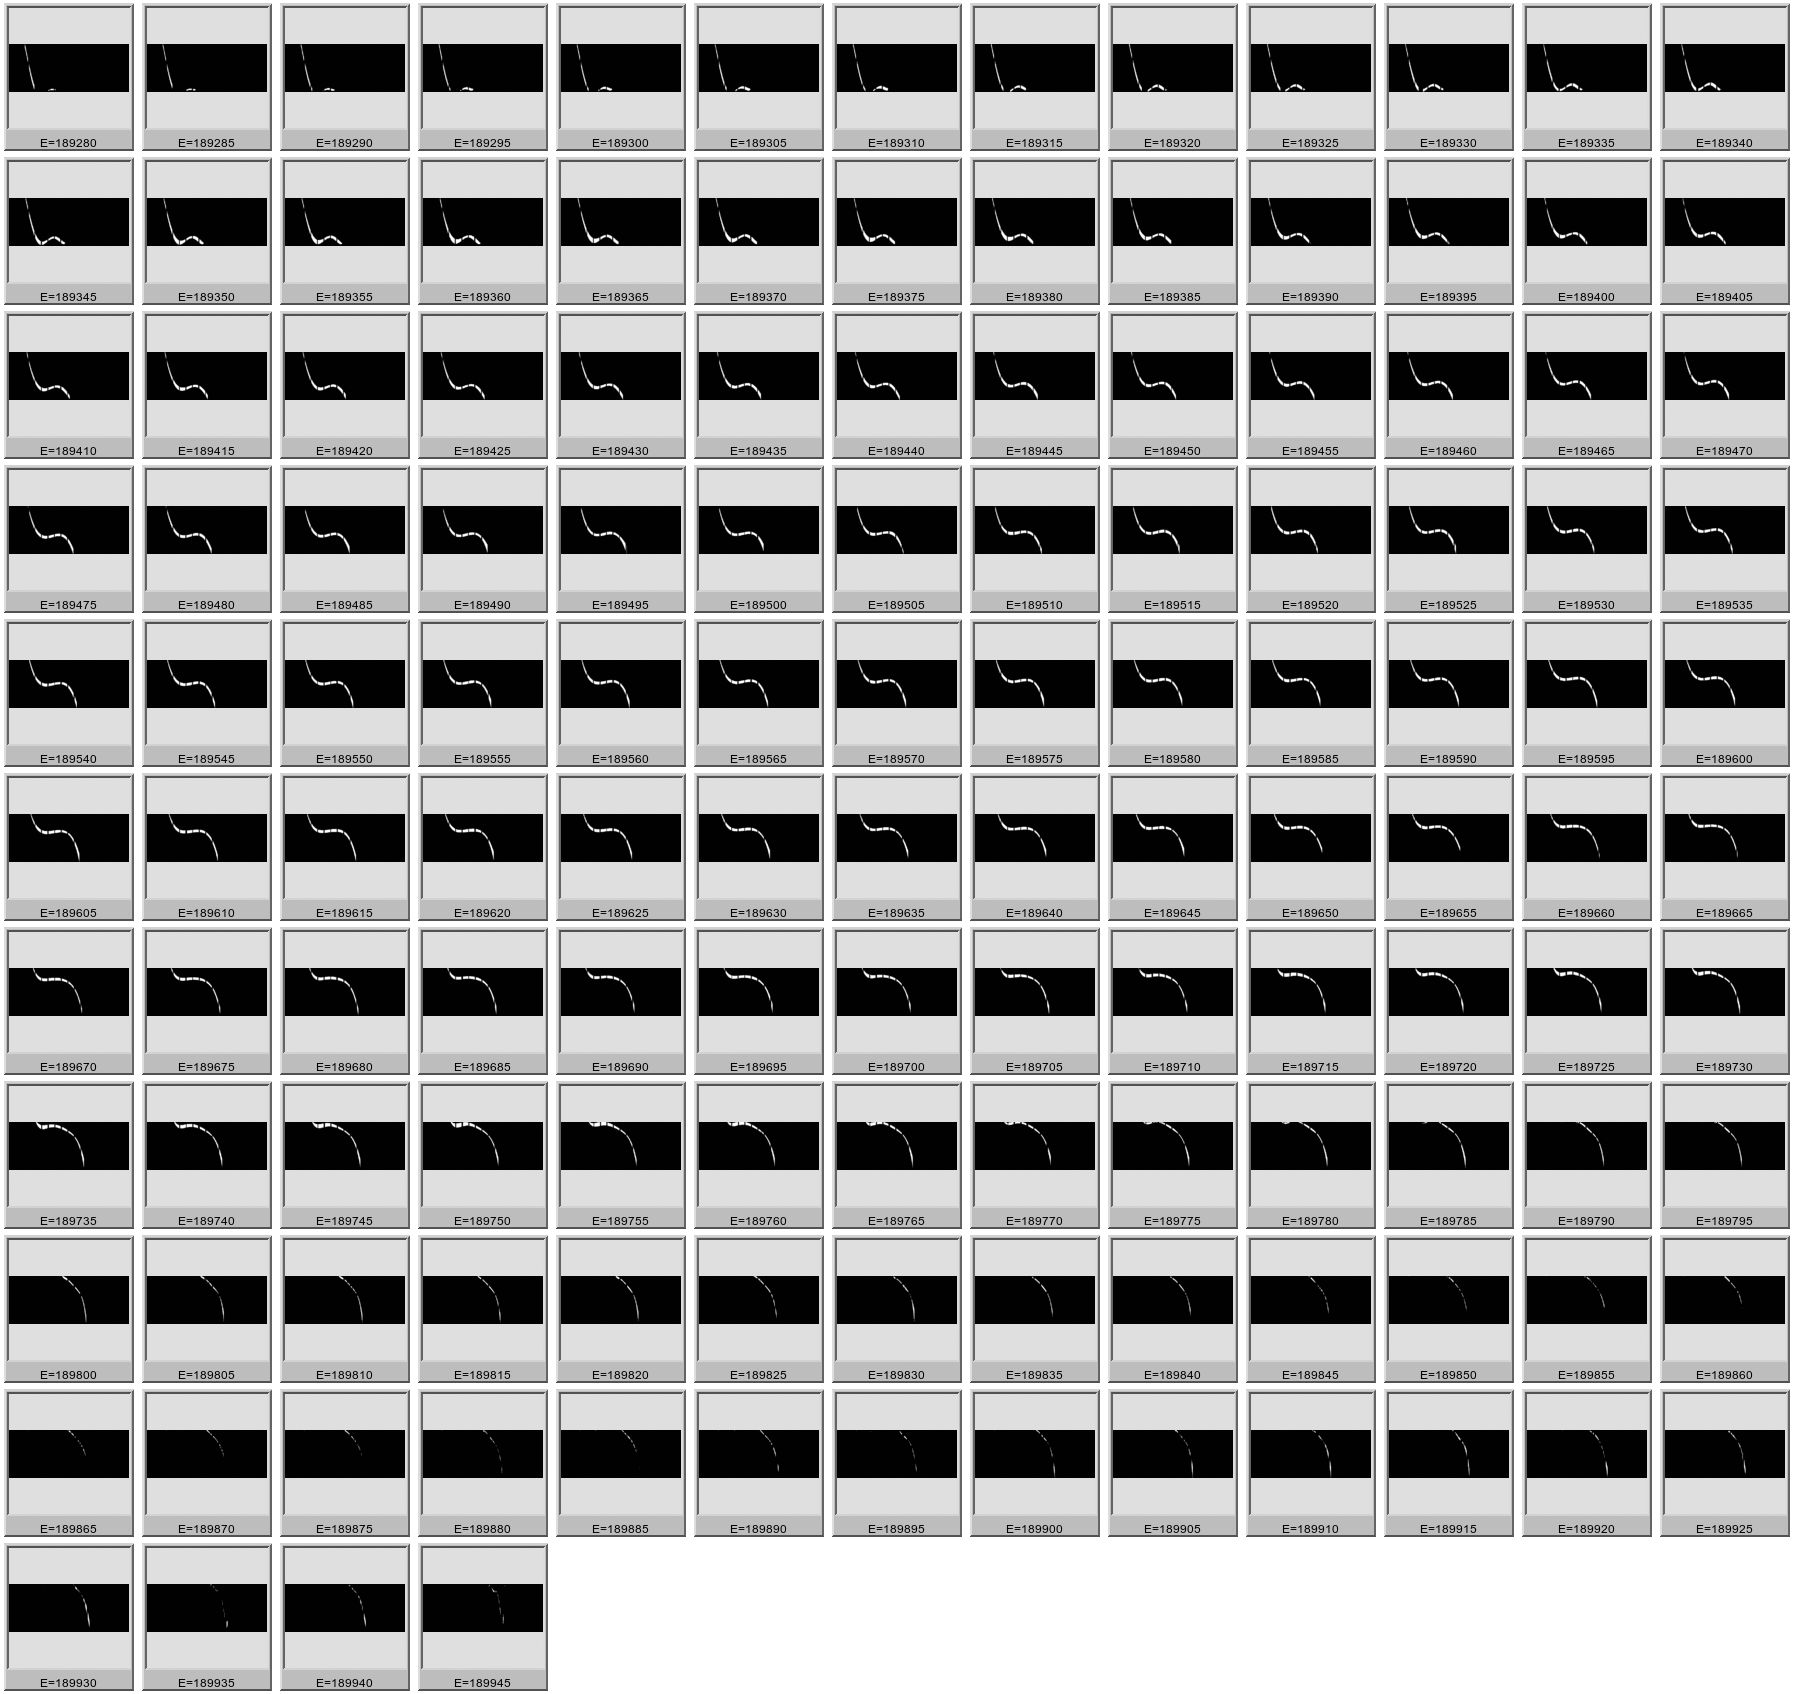
The sequence of masks made from elastic images measured from 18928 eV to 18994.5 eV,
Here, in full size, are the masks from the peaks of the Nb Kβ2 and Nb Kβ4 emission lines at 18952.5 eV and 18981.5 eV

The mask for the peak of the Nb Kβ2 emission line

The mask for the peak of the Nb Kβ4 emission line
This command is used to create the masks and compute the XES
spectrum. In this case, Nb2O3_Kb2_2 is the file name stub.
bla xes -c ini/Nb2O3.ini --noscan --xesimage=1 -p Nb2O3_Kb2_2
The --noscan command line switch tells the bla program
that no scan file was written. In a HERFD measurement, the scan file
is used to map incident energy values to each image in the HERFD
measurement. It is also used to record I0 and other
detectors. For a non-resonant XES measurement, this file is not
written. Emission energy values are encoded in the file names of the
elastic images. File names are determined from the parameters in the
[files] block of the ini file.
The --xesimage switch tells the bla program which
non-resonant XES image to process. In this experiment, the XES
spectrum was measured 8 times and this command processes the first
measurement.
Here is the ini file specified by the -c switch. The [spots]
block is used to manually remove regions of the image from processing.
The polyfill step of the mask creation recipe is sensitive spurious
signal, such as from diffraction peaks. The xrange parameter sets
the range in width of the image which contains all the signal from the
sequence of elastic images. Pixels outside that range in width are
set to 0 in the mask, which helps to normalize the polyfill step.
[measure]
emission           = 189280 to 189945 by 5
scanfolder         = /home/bruce/Data/NIST/10ID/2016.02/Nb2O3_2
tiffolder          = /home/bruce/Data/NIST/10ID/2016.02/Nb2O3_2
outfolder          = /home/bruce/Data/NIST/10ID/2016.02/Nb2O3_2/processed
element            = Nb
line               = Lb2
tiffcounter        = 0001
energycounterwidth = 4
imagescale         = 40
outimage           = gif

[files]
scan               = %s.001
elastic            = %s_elastic_%e_%t.tif
image              = %s_%c.tif
xdi                = ini/nb.xdi.ini

## Nb2O3_2
[spots]
xrange = 60 336

[steps]
steps = <<END
bad 400 weak 0
gaussian 1.7
useshield 12
polyfill
END
Xray::BLA and METIS are copyright © 2011-2014, 2016 Bruce Ravel and Jeremy Kropf – This document is copyright © 2016 Bruce Ravel
This document is licensed under The Creative Commons Attribution-ShareAlike License.
If this software and its documentation are useful to you, please consider supporting The Creative Commons.