5.2. Spectral resolution and k-range
The first and second coordination shells in iron metal are at 2.49 and 2.87 Å. These closely spaced shells overlap considerably when the Fourier transform of the χ(k) data are plotted. Consequently, the iron foil data can be used to demonstrate the relationship between the Fourier transform k-range and spectral resolution.
We see the iron foil data plotted in the figure below using three different values for «kmax». The data are three identical copies of the 60K iron foil data and have had the background function removed in the same way.
For the smallest value of «kmax», 10 Å -1, the second shell appears only as a shoulder at about 2.5 Å. The shoulder becomes more pronounced when «kmax» is increased to 16 Å -1. Only when «kmax» is set to 22 Å -1, the entire measured data range, is the second coordination visible as a resolved peak.
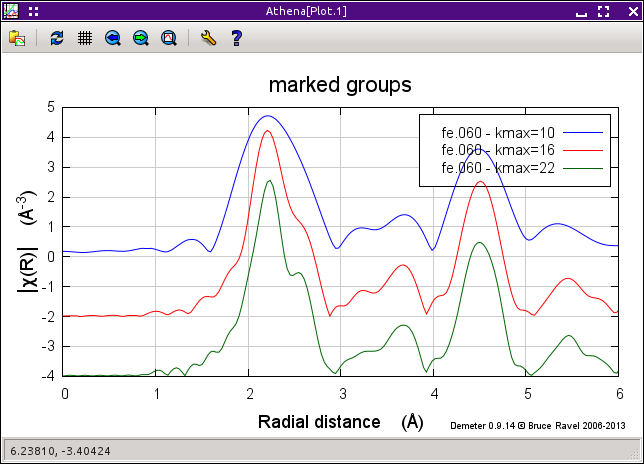
Fig. 5.5 Iron foil data, plotted with three different k-ranges.
DEMETER is copyright © 2009-2016 Bruce Ravel – This document is copyright © 2016 Bruce Ravel
This document is licensed under The Creative Commons Attribution-ShareAlike License.
If DEMETER and this document are useful to you, please consider supporting The Creative Commons.