6.7. The Monitor menu
The Monitor menu has several features that allow you to examine the current state of ATHENA.
ATHENA is, at heart, a code generator. When you press buttons, this triggers the creation of commands that tells IFEFFIT (or LARCH) what sequence of actions are necessary to process the data using the set of parameters currently displayed in the program. These commands are sent off to IFEFFIT (or LARCH). The same commands are also copied into the command buffer, which is the top part of Figure Fig. 6.15.
The command buffer serves a few purposes. It is used extensively whenever new features are added to ATHENA to make sure that the correct command are being generated when buttons are pressed. It is also useful to teach you, the user, the syntax of IFEFFIT (or LARCH), which can be useful if you would like to learn to use those tools for other purposes.
Plotting is handled slightly differently. The commands for actually making plots on screen are sent to the gnuplot program. The syntax of gnuplot is different, so the nature of the commands generated is different. These plot-related commands are copied into the bottom part of Figure Fig. 6.15.
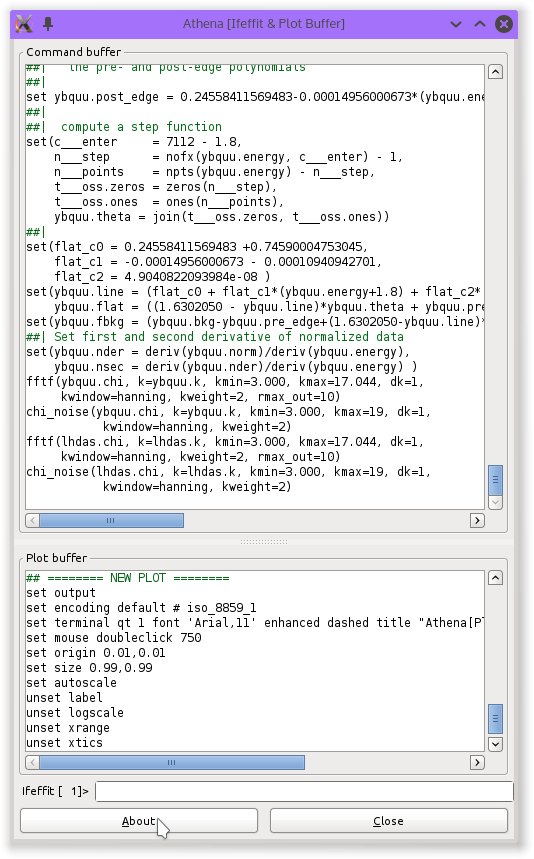
Fig. 6.15 The processing and plotting command buffers
At the bottom of the windows containing the command and plot buffer is a sort of command line, which can be used to send hand-typed commands directly to underlying IFEFFIT (or LARCH) engine.
The messages that are printed into the echo area at the bottom of the ATHENA window are copied into the status bar buffer. This serves as a loose record of the actions taken during this session with ATHENA.
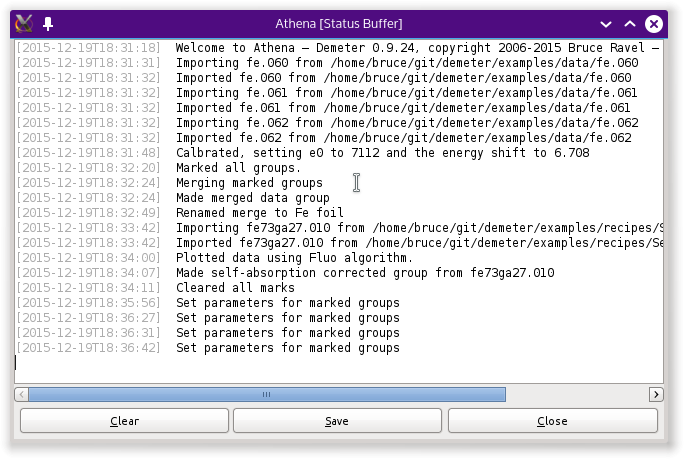
Fig. 6.16 The status bar buffer
When using the IFEFFIT backend, the Monitor menu has a couple items that facilitate certain interactions with IFEFFIT. The items in the submenu will display certain useful things in the command buffer. The menu entry for estimating the memory use in IFEFFIT may be helpful to avoid over-running its memory capacity. However, the method for estimating memory use is not especially reliable.
Finally, there is a submenu that displays a variety of data structures that give information about the current state of DEMETER. Most of these present some kind of serialization of DEMETER data structures n a way that is very helpful to Bruce when adding new features or debugging problems. A “yaml” is a way of serializing data into readable text.
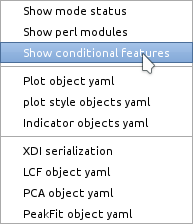
Fig. 6.17 The debugging submenu
If you set the ♦Athena→debug_menus configuration parameter to false, the debug menu will not be shown.
DEMETER is copyright © 2009-2016 Bruce Ravel – This document is copyright © 2016 Bruce Ravel
This document is licensed under The Creative Commons Attribution-ShareAlike License.
If DEMETER and this document are useful to you, please consider supporting The Creative Commons.