4.5. Energy-dependent normalization
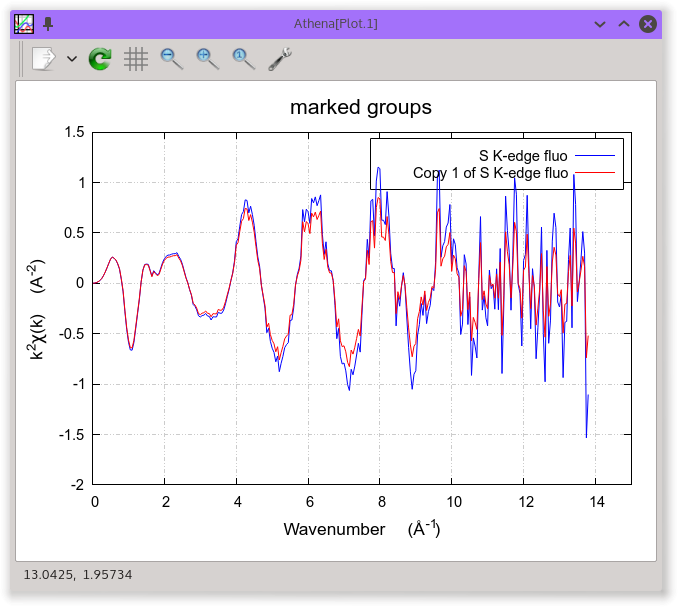
When measuring fluorescence data at low energy, the data might have an unusual overall shape as shown in the S K-edge data in the figure below. This behavior is due to the energy dependence of the signal on the gas-filled I0 chamber.
As the energy of the incident beam increases, the absorption of the gasses in I0 significantly decreases. Since the fluorescence signal if If/I0, the μ(E) grows with energy. Since the edge-step normalization of the data is made by dividing out a constant edge-step value, the energy-dependence of I0 results in a χ(k) signal that is somewhat amplified.
This amplification effect can be approximately corrected by an energy-dependent normalization. This is implemented using the pre- and post-edge lines. A function is computed as the difference between the post-edge and pre-edge lines. This difference function, which will be positive definite so long as the pre- and post-edge lines are well-behaved, is multiplied by μ(E) before performing the background removal.
The resulting corrected χ(k) is shown as the red trace in the right-hand figure above. The correction is small, but might contribute to the accuracy of an EXAFS analysis.
Caution
This sort of correction is only valid for low-energy EXAFS data measured in fluorescence. Using this tool incorrectly can damage your χ(k) data in a way that is difficult to understand after the fact. Also, using this tool with poorly chosen pre- or post-edge lines will damage the data. It is up to you to be sure those lines are chosen sensibly.
The control for this energy-dependent normalization is the checkbutton near the bottom of the background removal section of controls, as seen in the following screenshot.

Fig. 4.28 S K-edge EXAFS data measured in fluorescence. Note that the control for turning on the energy-dependent normalization is enabled.
This control is normally disabled. To enable it, you must toggle on the ♦Athena→show�_funnorm configuration parameter. If you import a project file which has one or more groups using the energy-dependent normalization, then the control will be turned on automatically.
Caution
Enabling this feature makes project files for both ATHENA and ARTEMIS incompatible with versions before 0.9.23. If you want to use this feature and share your project files with others who are using older version of the software, they will not be able to import your project files.
Caution
Another word of caution about using this feature of ATHENA. When you make a plot in energy, the function that gets plotted is μ(E) and it's background, not the corrected μ(E) and it's background. However, χ(k), χ(R), and χ(q) are made from the corrected μ(E). It is possible, paticularly for especially noisy data, that the background removal displayed for the raw μ(E) will be substantively different from the background calculated for the corrected μ(E). Thus it is possible that a plot in energy might look sensible, but the plot in k will be garbage. Or vice-versa. Again, use this feature of ATHENA with caution and foreknowledge.
DEMETER is copyright © 2009-2016 Bruce Ravel – This document is copyright © 2016 Bruce Ravel
This document is licensed under The Creative Commons Attribution-ShareAlike License.
If DEMETER and this document are useful to you, please consider supporting The Creative Commons.


