4.6. Data measured over a very short energy range
When measuring XANES data, the experimenter might be tempted to severely restrict the range of the measurement to a narrow span just around the edge energy. For example, the short span of the red trace in Fig. 4.29 includes the three small peaks in the edge that positively identify the species as FeS2. Shouldn't it then be sufficient just to measure that short data range?
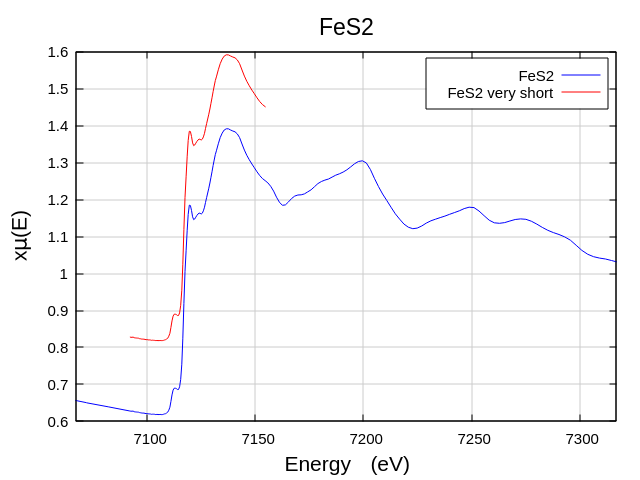
Fig. 4.29 Data on FeS2 truncated to the region just around the edge.
In a certain sense, the answer to that question might be “yes”. If the whole purpose of the measurement is to be a fingerprinting exercise – is this sample FeS2 or is it something else? – then the data measured over that very short energy might be adequate. However, XANES data are used for lots of things other than mere fingerprinting.
Any quantitative interpretation of the XANES data, for example linear combination fitting or principle components analysis, requires that the data be normalized in a sensible, defensible, reproducible manner. Without access to the full data range, it is very difficult to a good job of normalizing the short-range XANES data.
This is easy to see with this example. Because the data are truncated somewhere in the midst of the first big oscillation after the edge, it is basically impossible to know where the post-edge line should go. There simply isn't enough data to establish the trend that the post-edge line is designed to follow. Without that information, the value of the edge step cannot be determined accurately, possibly resulting in a very large systematic uncertainty in the edge-step normalization parameter. This large uncertainty would then have a significant impact on any quantitative analysis attempted using these data.
Severely restricting the pre-edge region can have a similar impact on the normalization. Although this example has enough of the pre-edge region to do a reasonable job with the pre-edge line, that would not be true if it were much shorter.
It is for this reason that good experimental practice is to measure a reasonable amount of data both before and after the edge. Even for a XANES study, it is a good idea to measure at least 100 eV before the edge and at least 300 eV after. If you are very concerned with time, you can consider measuring very sparsely outside the edge region. With even as few as 10 points in the post-edge region, it becomes possible to normalize the red trace in Fig. 4.29 in a reliable fashion.
Note, though, that the advice on data range depends on the situation. In Fig. 4.30, we see oxygen K-edge data measured on CaTiO3. The EXAFS is often weak in data measured on low energy edges. In this case a reasonable normalization is possible even though the data only extend about 90 eV above the edge. Even so, another few widely-spaced data points would have made it much easier to reliable process these data.
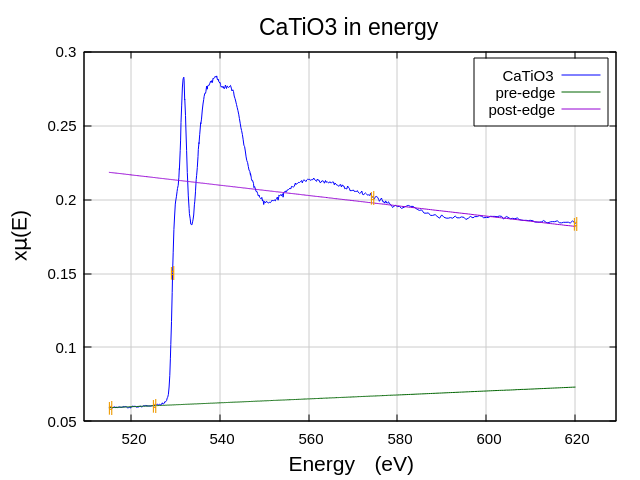
Fig. 4.30 Oxygen K-edge Data on CaTiO3 measured at a soft x-ray beamline.
In some situations, the MBACK algorithm might help normalize short data in a sensible manner. But even that algorithm is not completely stable with respect to such a short data range. MBACK is implemented in Larch but is not at this time available in ATHENA.
- Tsu-Chien Weng, Geoffrey S. Waldo, and James E. Penner-Hahn. A method for normalization of X-ray absorption spectra. Journal of Synchrotron Radiation, 12(4):506–510, Jul 2005. doi:10.1107/S0909049504034193.
DEMETER is copyright © 2009-2016 Bruce Ravel – This document is copyright © 2016 Bruce Ravel
This document is licensed under The Creative Commons Attribution-ShareAlike License.
If DEMETER and this document are useful to you, please consider supporting The Creative Commons.