5.4. Indicators
Indicators are vertical lines drawn from the top to the bottom of the plot frame. They are used to draw attention to specific points in plots of your data. This can be useful for comparing specific features in different data sets or for seeing how a particular feature propagates from energy to k to q.
Points to mark by indicators are chosen using the pluck buttons in the indicators tab. Click on the pluck button then on a spot in the plot. That value will be inserted into the adjacent text entry box. When the check button is selected, that indicator lines will be plotted (if possible) in each subsequent plot.
Points selected in energy, k, or q are plotted in any of those spaces. Points selected in R can only be plotted in R. Points outside the plot range are ignored.
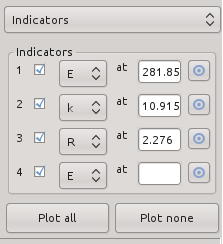
Fig. 5.8 The indicator tab.
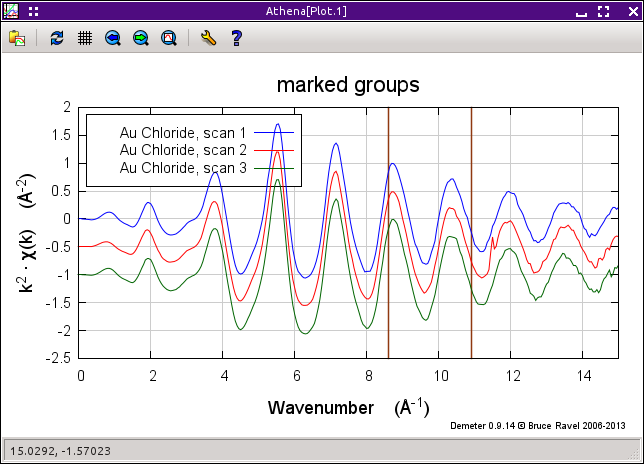
Fig. 5.9 An example of a plot with indicators. Note that plots made in E, k, or q will plot indicators selected in any of those three spaces.
The following preferences can be set to customize the appearance of the indicators.
- ♦Plot→nindicators: the maximum number of indicators that can be set
- ♦Plot→indicatorcolor: the color of the indicator line
- ♦Plot→indicatorline: the line type of the indicator
DEMETER is copyright © 2009-2015 Bruce Ravel – This document is copyright © 2015 Bruce Ravel
This document is licensed under The Creative Commons Attribution-ShareAlike License.
If DEMETER and this document are useful to you, please consider supporting The Creative Commons.