5.3. Stacked plots
When marked group plots are made using the purple plot buttons, the default behavior is to overplot the various data groups. At times, it might be preferable to place an offset between the plots. This is done in general by setting the «y-axis offset» parameter. Stacking plots in a systematic manner is done using the stack tab. Stacking is done by setting the «y-axis offset» parameters of the marked groups sequentially.
This tab contains two text entry boxes. The first is used to set the «y-axis offset» parameter of the first marked group. Subsequent marked groups have their «y-axis offset» parameters incremented by the amount of the second text entry box. Clicking the Apply to marked button sets these values for each marked group.
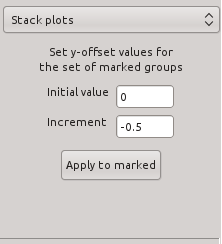
Fig. 5.6 The plot stacking tab.
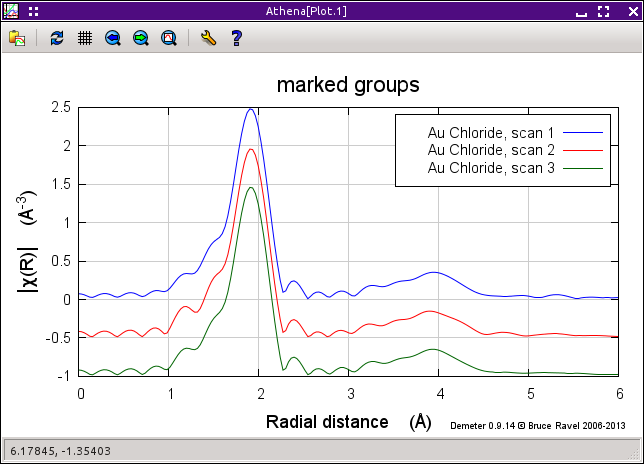
Fig. 5.7 An example of a stacked plot. Note that the stacking increment is negative so that that order of the colors is the same in the legend as in the plot.
DEMETER is copyright © 2009-2015 Bruce Ravel – This document is copyright © 2015 Bruce Ravel
This document is licensed under The Creative Commons Attribution-ShareAlike License.
If DEMETER and this document are useful to you, please consider supporting The Creative Commons.