Handling dopants in Feff
Overview
This section is adapted from the answer to a Frequently Asked Question
at the Ifeffit Wiki.
ATOMS is, except in extremely contrived situations, not capable of
writing a proper feff.inp file for a doped
material. This is not a programming shortcoming of ATOMS (or its
author!), but a number theoretic limitation imposed by the physical
model used by FEFF.
In the feff.inp file, there is a big list of
atomic coordinates. The reason that people like using ATOMS is
because, without ATOMS, it is a pain in the ass to generate that
list. The virtue of ATOMS is that it automates that annoying task for
a certain class of matter, i.e. crystals.
FEFF expects a point in space to be either unoccupied or occupied by a
specific atom. A given point may be occupied neither by a fraction of
an atom nor by two different kinds of atoms.
Let's use a very simple example -- gold doped into FCC
copper. In FCC copper, there are 12 atoms in the first shell. If the
level of doping was, say, 25 percent , then ATOMS could reasonably
select 3 of the 12 nearest neighbors at random and replace them with
gold atoms. However, what should ATOMS do with the second shell,
which contains 6 atoms? 25 percent of 6 is 1.5. FEFF does not
allow a site to be half occupied by an atomic species, thus ATOMS
would have to decide either to over-dope or under-dope the second
shell.
This problem only gets worse if the doping fraction is not a rational
fraction, if the material is non-isotropic, or if the material has
multiple sites that the dopant might want to go to.
Because ATOMS cannot solve this problem correctly except in the
most contrived of situations, its author decided that ATOMS would
not attempt to solve it in any situation. If you specify dopants in
ATOMS' input data, the list in the feff.inp file will be be made as if there are no dopants.
This leads to two big questions:
Why would dopants be allowed in ATOMS in any capacity?
How does one deal with XAS of a doped sample?
The first question is the easy one. At the programming level in
DEMETER, ATOMS can do other things besides generating
feff.inp files. Calculations involving
tables of absorption coefficients, simulations of powder diffraction,
and simulations of DAFS spectra could all effectively use of the
dopant information. In ARTEMIS you will notice that there is not
even a column for specifying occupancy -- in ARTEMIS occupancy can
only be 1.
The second question is the tricky one and the answer is somewhat
different for EXAFS as for XANES. The bottom line is that you need to
be creative and willing to run FEFF more than once.
The best approach to simulating a XANES spectrum on a doped material
that I am aware of also involves running FEFF many times. One
problem a colleague of mine asked me about some time ago was the
situation of oxygen vacancies in Au2O3. After some discussion, the
solution we came up with was to use ATOMS to generate the
feff.inp for the pure material. This fellow
then wrote a little computer program that would read in the feff.inp file, randomly remove oxygen atoms from the
list, write the feff.inp file back out with
the missing oxygens, and run FEFF. He would do this repeatedly,
each time replacing a different set of randomly selected atoms and
each time saving the result. This set of computed spectra was then
averaged. New calculations were made and added to the running average
until the result stopped changing. If I remember, it took about 10
calculations to converge.
This random substitution approach would work just as well for dopants
as for vacancies.
Crystal data with partial occupancy
A structure for the mineral zirconolite, CaZrTi2O7, was
published as
H. J. Rossell, Nature, 283,
(1980) p. 282--283 (DOI: 10.1038/283282a0). In that paper, significant site swapping was found between the
site occupied by Zr and one of the Ti sites. Consequently, the CIF
file is published with partial occupancies for those tow sites.
Here is the CIF file.
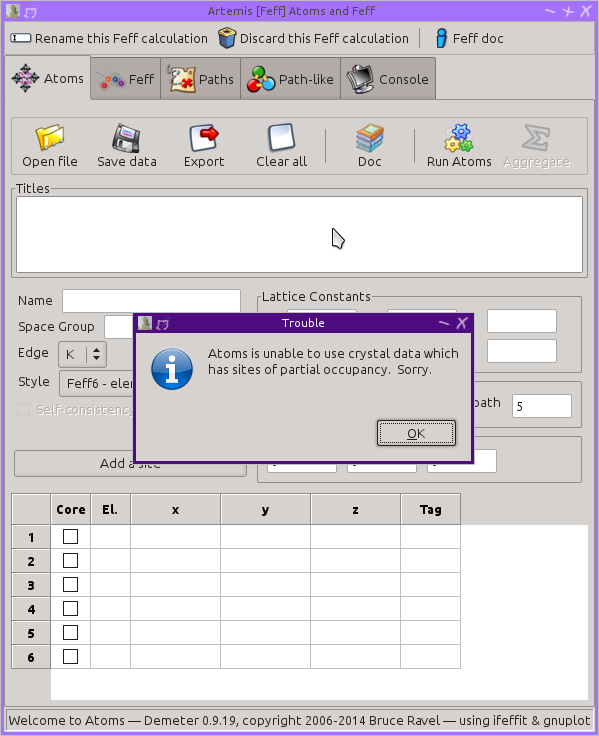
When this CIF file is imported into ARTEMIS, you see this error
message:
To use this crystal data in ARTEMIS, you need to edit the CIF file
before importing it to remove the examples of partial occupancy.
Change the last loop from this:
loop_
_atom_site_label
_atom_site_fract_x
_atom_site_fract_y
_atom_site_fract_z
_atom_site_occupancy
CaM1 0.37180 0.12450 0.49520 1.00000
ZrM2 0.12250 0.12220 -0.02580 0.93000
TiM2 0.12250 0.12220 -0.02580 0.07000
TiM3 0.24980 0.12230 0.74650 1.00000
TiM4 0.50000 0.05500 0.25000 0.86000
ZrM4 0.50000 0.05500 0.25000 0.14000
TiM5 0.00000 0.12700 0.25000 1.00000
O1 0.31000 0.13300 0.27500 1.00000
O2 0.47000 0.14600 0.10200 1.00000
O3 0.19700 0.08300 0.57300 1.00000
O4 0.40300 0.17400 0.71900 1.00000
O5 0.70200 0.16900 0.59000 1.00000
O6 -0.00100 0.11100 0.41400 1.00000
O7 0.11900 0.05500 0.78800 1.00000
to this:
loop_
_atom_site_label
_atom_site_fract_x
_atom_site_fract_y
_atom_site_fract_z
_atom_site_occupancy
CaM1 0.37180 0.12450 0.49520 1.00000
ZrM2 0.12250 0.12220 -0.02580 1.00000
TiM3 0.24980 0.12230 0.74650 1.00000
TiM4 0.50000 0.05500 0.25000 1.00000
TiM5 0.00000 0.12700 0.25000 1.00000
O1 0.31000 0.13300 0.27500 1.00000
O2 0.47000 0.14600 0.10200 1.00000
O3 0.19700 0.08300 0.57300 1.00000
O4 0.40300 0.17400 0.71900 1.00000
O5 0.70200 0.16900 0.59000 1.00000
O6 -0.00100 0.11100 0.41400 1.00000
O7 0.11900 0.05500 0.78800 1.00000
To analyze your data while considering the partical occupancy, try one
of the techniques discussed in the following section.
Doped crystal and alloys
This section is adapted from text posted by Scott
Calvin to the Ifeffit Wiki and retains his voice.
For samples which are doped crystals, there are a couple of methods
people have used. For purposes of this article, I'll consider
cases where the dopant is substitutional as opposed to interstitial
(maybe someone could edit this article to include that case?).
As an example of two methods, let's consider FeS2
substitutionally doped with molybdenum. (I have no idea if such a
material is possible...I'm using it because FeS2 is included
as an example in the DEMETER distrribution.)
Method 1
Run atoms for FeS2.
Now look at the feff.inp file that is
generated. Under “Potentials”, it says the
following:
 POTENTIALS
 *    ipot   Z  element
        0   26   Fe
        1   26   Fe
        2   16   S
Add another line for the Mo, which is atomic number 42 (the atomic
number is required):
 POTENTIALS
 *    ipot   Z  element
        0   26   Fe
        1   26   Fe
        2   16   S
        3   42   Mo
Important: Do not skip numbers in the “ipot” column, and make sure “0” is the absorber!
Next, take the list following the word “ATOMS” in the feff.inp file,
and arbitrarily change roughly the right number of iron atoms to moly
atoms. Make sure to change the “ipot” column to match...it's the part
feff will actually use:
 ATOMS                          * this list contains 71 atoms
 *   x          y          z      ipot  tag              distance
    0.00000    0.00000    0.00000  0    Fe1              0.00000
    2.07514    0.62686    0.62686  2    S1_1             2.25657
    0.62686   -2.07514    0.62686  2    S1_1             2.25657
   -0.62686    0.62686    2.07514  2    S1_1             2.25657
   -0.62686    2.07514   -0.62686  2    S1_1             2.25657
   -2.07514   -0.62686   -0.62686  2    S1_1             2.25657
    0.62686   -0.62686   -2.07514  2    S1_1             2.25657
   -3.32886    0.62686    0.62686  2    S1_2             3.44488
    0.62686    3.32886    0.62686  2    S1_2             3.44488
    0.62686   -0.62686    3.32886  2    S1_2             3.44488
    3.32886   -0.62686   -0.62686  2    S1_2             3.44488
   -0.62686   -3.32886   -0.62686  2    S1_2             3.44488
   -0.62686    0.62686   -3.32886  2    S1_2             3.44488
   -2.07514   -2.07514    2.07514  2    S1_3             3.59425
    2.07514    2.07514   -2.07514  2    S1_3             3.59425
    2.70200    2.70200    0.00000  1    Fe1_1            3.82121
   -2.70200    2.70200    0.00000  3    Mo1_1            3.82121
    2.70200   -2.70200    0.00000  1    Fe1_1            3.82121
   -2.70200   -2.70200    0.00000  1    Fe1_1            3.82121
    2.70200    0.00000    2.70200  1    Fe1_1            3.82121
   -2.70200    0.00000    2.70200  3    Mo1_1            3.82121
    0.00000    2.70200    2.70200  1    Fe1_1            3.82121
    0.00000   -2.70200    2.70200  1    Fe1_1            3.82121
    2.70200    0.00000   -2.70200  1    Fe1_1            3.82121
   -2.70200    0.00000   -2.70200  3    Mo1_1            3.82121
    0.00000    2.70200   -2.70200  1    Fe1_1            3.82121
    0.00000   -2.70200   -2.70200  1    Fe1_1            3.82121
   -2.07514    3.32886    2.07514  2    S1_4             4.43776
In this case, I changed 3 of the 12 nearest iron neighbors into
moly...reasonable if I have about 25 percent doping.
If you are doing a FEFF calculation for the moly edge, then also change the very first iron to moly, and change
potential 0 in the ipot list to moly with ipot 0.
 POTENTIALS
 *    ipot   Z  element
        0   42   Mo
        1   26   Fe
        2   16   S
        3   43   Mo

 ATOMS                          * this list contains 71 atoms
 *   x          y          z      ipot  tag              distance
    0.00000    0.00000    0.00000  0    Mo1              0.00000
    2.07514    0.62686    0.62686  2    S1_1             2.25657
    0.62686   -2.07514    0.62686  2    S1_1             2.25657
   -0.62686    0.62686    2.07514  2    S1_1             2.25657
   -0.62686    2.07514   -0.62686  2    S1_1             2.25657
If you are doing the calculation for the iron edge, leave the first
iron alone, since it is still the absorber.
Now run FEFF, and you'll get the iron scattering paths
listed separately from the moly scattering paths.
One more step ... correcting for the actual doping fraction. Suppose
there is actual 20 percent moly and not 25 percent, as we implied. We
couldn't have handled that just through feff, because we
can't change exactly 20 percent of 12 atoms...we have to change
2, which is 17 percent, or 3, which is 25 percent.
The fix for this is to change the S²₀ in the moly and sulfur
scattering paths to account for this. You could, for example, use the
following GDS parameters:
set: MolyPercent = 0.20
def: IronPercent = 1-MolyPercent
Then go to the individual path representing the scattering off of
nearest neighbor moly, and assign it an S²₀ of
amp*MolyPercent/(3/12)
That way, if the MolyPercent is 20 percent, it will reduce the
amplitude of those paths by 20/25 percent, as is proper.
Of course, the iron scatterer would get an S²₀ of
amp*IronPercent/(9/12)
That's more or less it!
You could, of course, guess the MolyPercent instead of setting it, if
for some reason it was unknown in your sample.
Method 2
Suppose we want to analyze the iron edge.
Run atoms for FeS2 and then run FEFF.
Then make a new ATOMS page, type or read in the FeS2 file, and
just change the Fe to Mo. Run ATOMS again.
If you're doing the iron edge, then change the absorber to iron
in the feff.inp file (this requires changing
the potential list; see the description under "Method 1" for how to do
this.) Run FEFF.
(If you want to analyze the moly edge, then of course you change the
feff.inp file in the first calculation to
moly and leave it as moly in the second.)
You now have two sets of FEFF files
associated with one data set.
Make GDS parameters:
set: MolyPercent = 0.20
def: IronPercent = 1-MolyPercent
Now make the S²₀ for all paths calculated with the original ATOMS file:
amp*IronPercent
and for all paths calculatged with the new ATOMS file:
amp*MolyPercent
Again, you can guess the MolyPercent if it's unknown.
Discussion of these two methods
Which method you use is largely a matter of taste. The first method is
easier to screw up, since there's a lot of counting involved. On the
other hand, it generates many fewer paths, and thus makes for smaller
files and may fit faster (you're not wasting time and effort counting
sulfur paths twice, for example). The first method also gives you the
potential of finding a few multiple scattering paths that involve both
iron and moly (in this example) that you can't probe at all by the
second method. This is most likely to be true when the dopant is in
low concentrations but is high-Z...it's possible that there may be a
moly-iron multiple-scattering path that is significant, and it's not
going to be modeled so well by the weighted average of iron-iron and
moly-moly paths used in method 2. But the price for this is that
properly incorporating multiple-scattering paths via method 1 requires
an annoying amount of counting and thinking.