9.13. Data summation
This tool is used to make arbitrary sumations of data. This is a little bit like the linear combination fitting tool and a little bit like the difference spectrum tool, but different. This tool allows you to make an arbitrary summation of μ(E), normalized μ(E), or χ(k) data. There is no requirement that the specified weights be positive or sum to one.
Plots can optionally include the scaled components or the marked groups from the group list. If the summation is made on χ(k) data, the button for plotting as χ(R) will be enabled.
A group can be made from the summation and inserted into the group list. That new group will be treated like normal data.
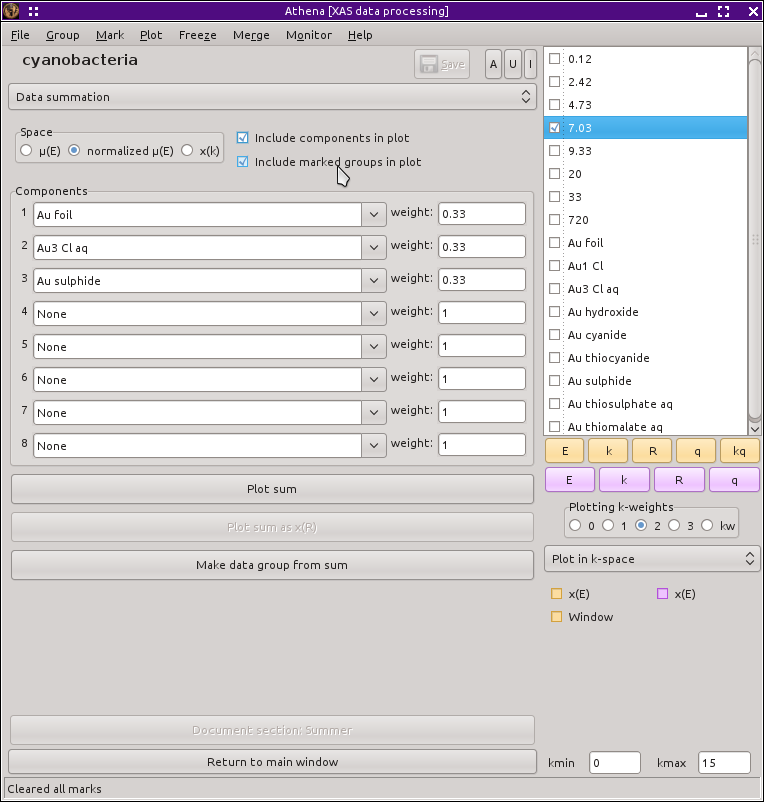
Fig. 9.37 The data summation tool.
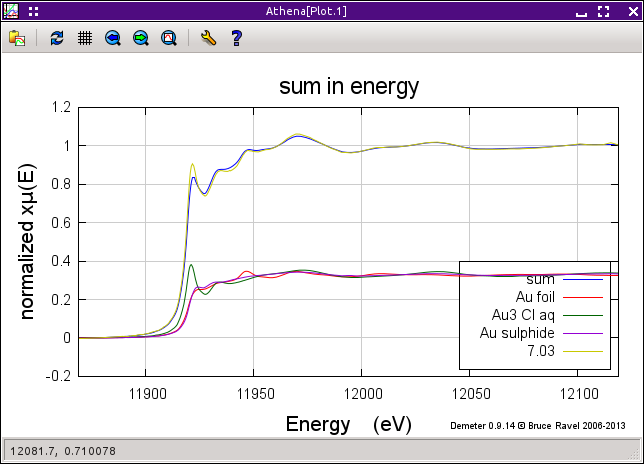
Fig. 9.38 A plot containing an arbitrary sum of three standards. Included in the plot is the marked group from the group list and the three standards scaled by the specified weight.
DEMETER is copyright © 2009-2016 Bruce Ravel – This document is copyright © 2016 Bruce Ravel
This document is licensed under The Creative Commons Attribution-ShareAlike License.
If DEMETER and this document are useful to you, please consider supporting The Creative Commons.